Objective
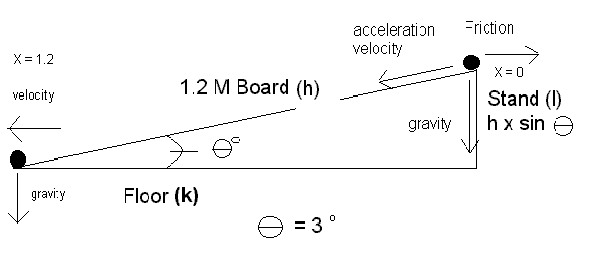
The main Objective of this lab is to study the special case of unidirectional kinematics that involves constant acceleration. This is accomplished by studying an object under the influence of a gravitational field such that the force upon it is equal to the gravitational constant multiplied by the sine of the angle of the plane on which it moves with respect to a level surface.
Procedures
Construct plane at 3o to a nearly level surface, and select an object with a small moment of inertia.
Simultaneously start a timer and the object rolling.
Record location of object at fixed time intervals.
Measure distances with respect to the starting point.
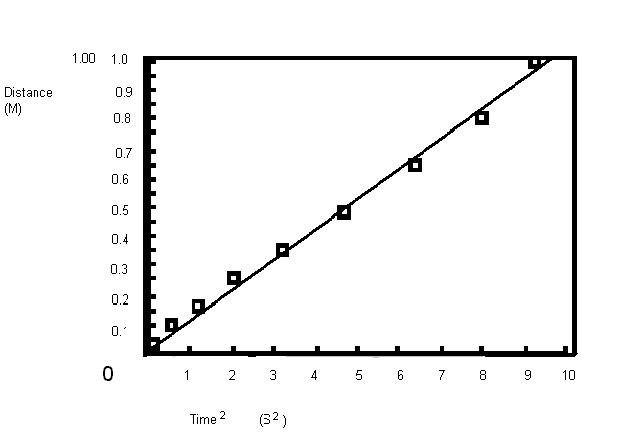
Calculate Distance v Time, Velocity v Time, and Acceleration v Time.
Chart Graphs
Illustrations
Basic Setup:

Notes
There are many problems that had to be overcome concerning the accuracy of this lab. First of all, there was no account for the forces of friction, the moment of inertia, and the corollas effect. Also, the time intervals between the set distances were so minute; they were difficult to record, even with the aid of my computer program. Also, in order to successfully record all of the times, I had to write a computer program that would do the timing. With all of the error involved, it is difficult to be sure that the results given are entirely accurate.
Tables
Table 1: Data at a 3o inclination.
