![]() Objective
Objective
The objective of this lab is to become familiar with the high frequency spectrum analyzer by viewing the frequency spectra of frequency modulated and amplitude modulated waveforms.
![]() Equipment Used
Equipment Used
1) HP 3585 Spectrum Analyzer #3585A
2) HP 3311 Function Generator #1645
3) HP 3312A Function Generator #10468
![]() Procedure
Procedure
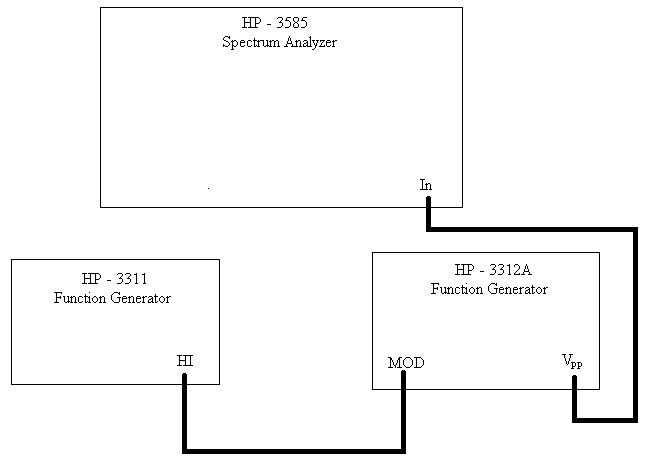
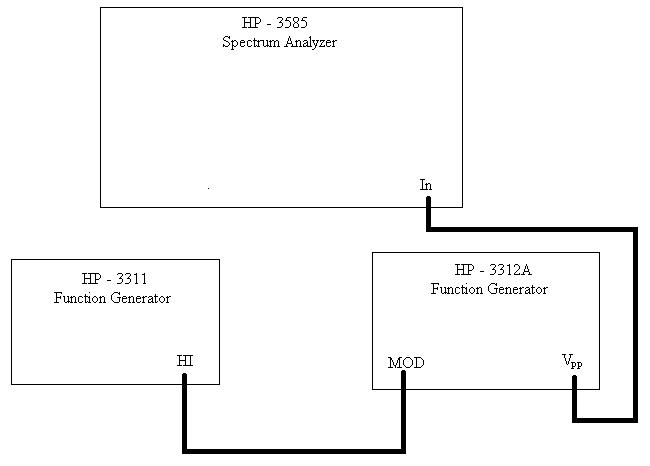
1) Assemble the equipment as shown:

2) Power the two signal generators and the spectrum analyzer and set their settings to the following:
a) HP 3311:
i) Dial to 4
ii) Frequency to 10KHz
iii) Sinewave
iv) Amplitude to 7 o'clock
b) HP 3312A
i) Dial to 4
ii) Frequency to 1MHz
iii) Modulation knob to 7 o'clock position
iv) Amplitude .01V
c) Spectrum Analyzer
i) 50W input impedance
ii) Continuous sweep
iii) Trace A
3) Press the step size button.
4) Press the up button until the step is 1,000,000Hz.
5) Press the Center Frequency button.
6) Press the down button fifteen times.
7) Press the Span button.
8) Press the down button until the span is 200KHz
9) Adjust the frequency dial until the HP3312A until a spike appears in the center of the screen.
10) Press the Marker button
11) Move the frequency dial until the marker is at the peak and record the frequency and dBm value.
12) Set the HP 3312A to external AM modulation with an amplitude of 1 Vpp.
13) Press Single Sweep on the analyzer and record the result.
14) Use the marker to record the dBm values and frequencies of the peaks.
15) Press Reference Level.
16) Record the voltages and frequencies using the marker.
17) Switch to continuous sweep.
18) Set the HP3312A to external FM with an amplitude of .01Vpp.
19) Set the analyzer to a span of 500KHz and record result.
20) Record the frequency of the peak and their respective voltage and dBm values.
![]() Results
Results
1) Diagram 1: Setup, Enlarged View

2) Table
1: Frequency and dBm Values for Single Wave
|
|
Frequency: |
dBm Value: |
|---|---|---|
|
Sine Wave: |
4,997,000Hz |
-57.1dBm |
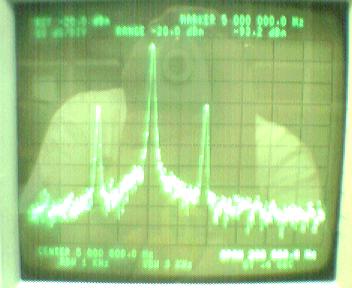
3) Diagram 2: AM Frequency Spectrum

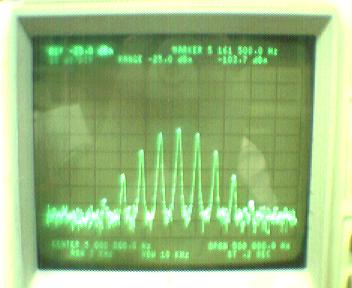
4) Diagram 3: FM Frequency Spectrum

5) Table 2: Frequencies, dBm Values, and Voltages for AM Wave
|
|
Frequency: |
dBm: |
Voltage: |
|---|---|---|---|
|
Center: |
4,981,400Hz |
-22.7dBm |
1.64mV |
|
LSB: |
4,945,400Hz |
-55.9dBm |
636mV |
|
USB: |
5,017,600Hz |
-55.3dBm |
684mV |
6) Table 3: Frequencies, dBm Values, and Voltages for FM Wave
|
|
Frequency |
dBm: |
Voltage: |
|---|---|---|---|
|
Center: |
5,014,500Hz |
-60.9dBm |
202mV |
|
FL1: |
4,978,000Hz |
-63.8dBm |
144mV |
|
FH1: |
5,051,000Hz |
-63.8dBm |
144mV |
|
FL2: |
4,941,000Hz |
-73.9dBm |
45.2mV |
|
FH2: |
5,088,500Hz |
-74.0dBm |
44.6mV |
|
FL3: |
4,904,500Hz |
-87.9dBm |
9.04mV |
|
FH3: |
5,125,500Hz |
-88.1dBm |
8.80mV |
|
FL4: |
4,867,500Hz |
-103.0dBm |
1.58mV |
|
FH4: |
5,161,500Hz |
-103.7dBm |
1.46mV |
![]() Answers To Lab Questions
Answers To Lab Questions
1) Q: What was the percent modulation of the AM wave?
A: m = .805
2) Q: What was the original unmodulated carrier amplitude of the FM signal?
A: Ec = 252mV
3) Q: What are the Bessel Functions of the FM wave?
A: J0 = .80, J1 = .57, J2 = .18, J3 = .04, J4 = .01
4) Q: What is the modulation index of the FM wave?
A: m Z 1.25
5) Q: What was the frequency difference of the FM sidebands?
A: Fmavg = 36,750Hz
![]() Conclusions
Conclusions
From this lab it, the basics of the spectrum analyzer is described. Also, the frequency spectra of both Frequency Modulation and Amplitude Modulation waves is described. For calculating the modulation index, the J values for the first half of the sidebands are high. I do not know what contributed to this error, but otherwise I feel that the lab is fairly accurate. A decent understanding of the spectrum analyzer has been obtained.
![]() Attachments
Attachments