The objective of this lab is to use a curve tracer to measure transistor parameters. Another objective of this lab is to construct and test base bias and voltage divider bias circuits. Then to observe the effect of b on the operating point of the test circuits.
Equipment Used
1) Trainer #:
2) Multimeter #:
3) Curve Tracer #:
4) Transistor Type: 2N3904
5) Additional components of the EL - 200 Lab kit
Procedure
I) Part A: Setting up the Curve Tracer
1) Set the peak voltage range switch to "low (20V)," and the comparison switch to the center position.
2) Power the curve tracer and warm it up for about 5 minutes.
3) Insert one transistor into each socket of the tester.
4) Set the tester to the following settings:
i) Dissipation limiting resistance = 1K
ii) Steps / sec = 240
iii) Steps / family = mid range
iv) Step control = .01mA / step
v) Both Polarity controls to NPN (+)
vi) Horizontal sensitivity = 2V / div
vii) Vertical Sensitivity = 2mA / div
viii) Collector sweep peak volts fully counter clockwise
ix) Base step = repetitive
5) Switch the transistor switch to `A' and increase the peak voltage until a good reading can be taken. If needed, fine tune the intensity and focus.
6) Adjust the controls so the trace is on the lowest division of the screen.
7) Hold the zero current - zero volts switch in the zero current position and further adjust the the position controls to set the trace aligns with the bottom horizontal.
8) Use the step zero control to further make the first trace coincide with the lowest division and to ensure that each step is an increment of 10mA.
9) Adjust the steps / family so that it is accurate for at least six traces
10) Increase the peak volts so that at least the first three traces extend the full width of the display.
II) Part B: Recording Information from the Curve Tracer
1) Using the display from the tracer, determine IC at VCE = 10V, and IB = 20mA
2) Compute b for that point
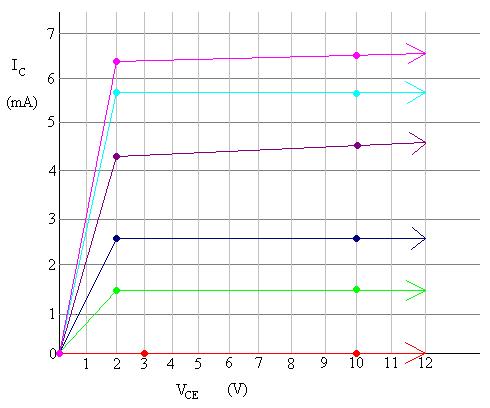
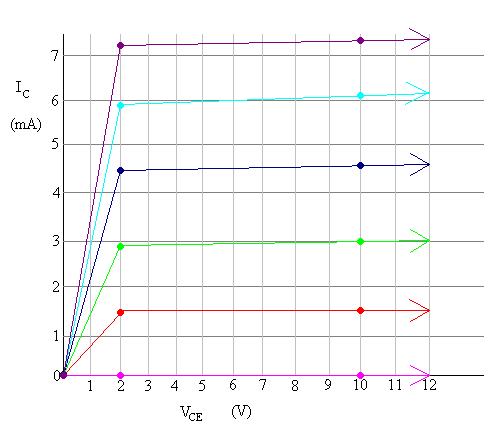
3) Record IC for each IB step at VCE = 2V and VCE = 10V, use the data to prepare a graph for the transistor
4) Set the transistor switch to the `B' position
5) Repeat steps 1 through 3
III) Part C: Bias Circuits:
a: Base Bias Circuit
1) Assemble
the following circuit:
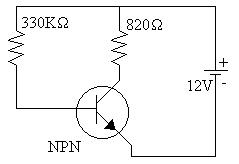
2) Record VRB, VRC, and VCE
3) Record IB, IC, and b
4) Repeat steps 2 and 3 using transistor 2
b: Voltage Divider Bias Circuit
1) Assemble the following
circuit:
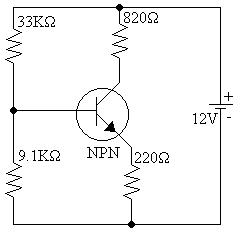
2) Record VRC and VC
3) Record IC
4) Repeat Steps 2 and 3 using transistor 2
Data
1) Table 1: Part B: Table of IC values for IB and VCE for Transistor 1
IB
|
VCE |
10mA |
20mA |
30mA |
40mA |
50mA |
60mA |
|---|---|---|---|---|---|---|
|
2V |
0mA |
1.5mA |
2.6mA |
4.2mA |
5.6mA |
6.4mA |
|
10V |
0mA |
1.5mA |
2.6mA |
4.4mA |
5.6mA |
6.5mA |
2) Table 2: Part B: Table of IC values for IB and VCE for Transistor 2
IB
|
VCE |
10mA |
20mA |
30mA |
40mA |
50mA |
60mA |
|---|---|---|---|---|---|---|
|
2V |
0mA |
1.6mA |
2.9mA |
4.5mA |
5.9mA |
7.2mA |
|
10V |
0mA |
1.6mA |
3.0mA |
4.6mA |
6.1mA |
7.3mA |
3) Table 3: Data from Part III, a
|
|
VRB |
VRC |
VCE |
IB |
IC |
b |
|---|---|---|---|---|---|---|
|
Transistor #1 |
11.28V |
3.330V |
8.67V |
34.2mA |
4.06mA |
119 |
|
Transistor #2 |
11.29V |
3.61V |
8.39V |
34.2mA |
4.40mA |
129 |
4) Table 4: Data from Part III, b
|
|
VRC |
VC |
IC |
|---|---|---|---|
|
Transistor #1 |
5.15V |
6.48V |
7.90mA |
|
Transistor #2 |
5.22V |
6.75V |
8.23mA |
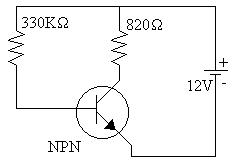
5) Diagram 1: Schematic 1, Enlarged View
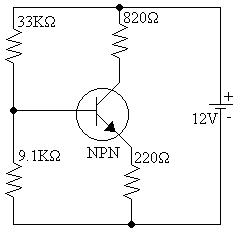
6) Diagram
2: Schematic 2, Enlarged View
7) Diagram 3: Graph of Transistor 1:
8) Diagram 4: Graph of Transistor 2:
Answers to Lab Questions
1) Q: Use the data obtained from part B to graph the transistors:
A: 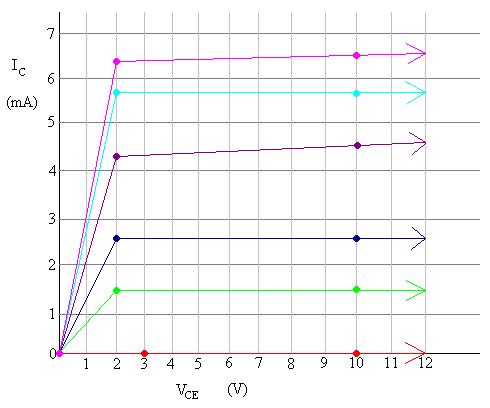
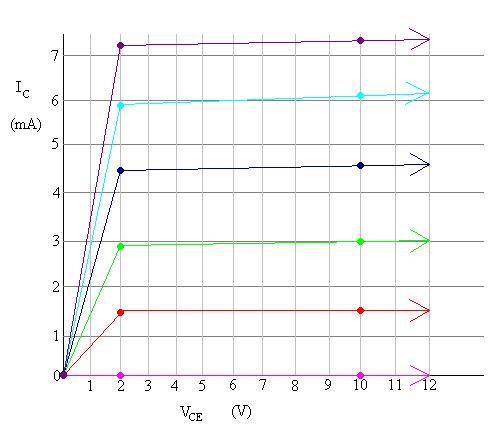
2) Q: Draw the load lines and show the Theoretical and actual Q points on the graph for circuit 2.
A: 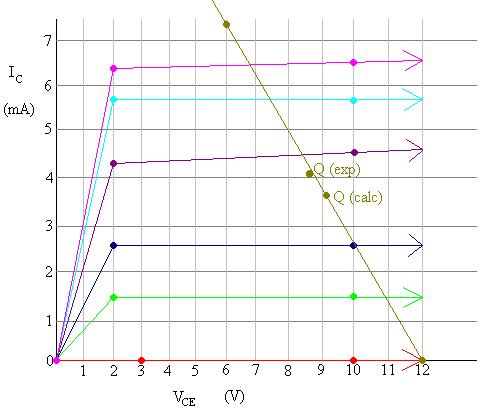
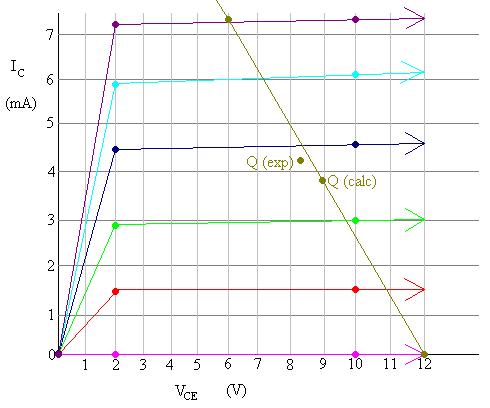
3) Q: Compare the theoretical Q point and experimental Q point values
A: In both circuits, the Q points are extremely close, but they are not exact.
4) Q: Plot the load line and Q points for circuit 3.
A: 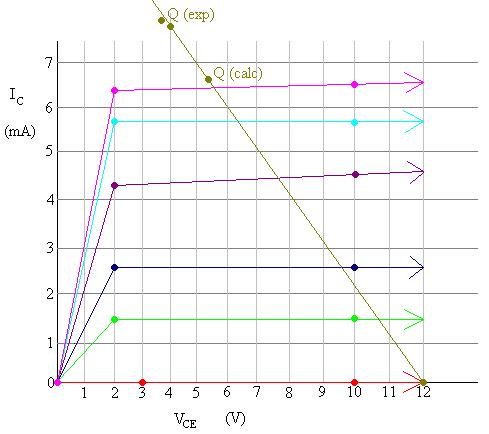
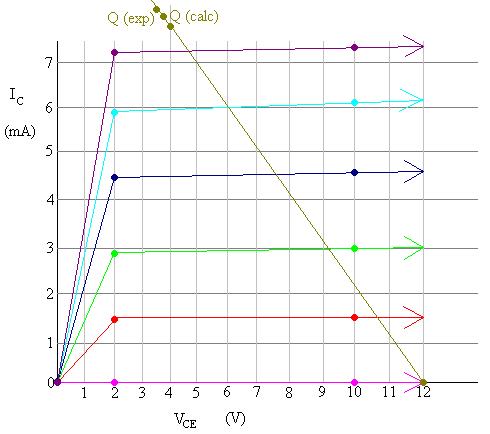
5) Q: Compare the theoretical Q points and the experimental Q points.
A: The Q points for transistor 2 are much closer than they are for transistor 1 but they seem closer together than they are for schematic 1.
6) Q: Compare the operating stability of the two circuits.
A: From the data shown, it appears that circuit 2 has a more stable operation than circuit 1 because the actual Q points and the calculated Q points are closer together.
Conclusions
From this lab it can be seen that the effects of a different b can be lessened by the construction of the circuit that uses the transistor.
Attachments