![]() Objective
Objective
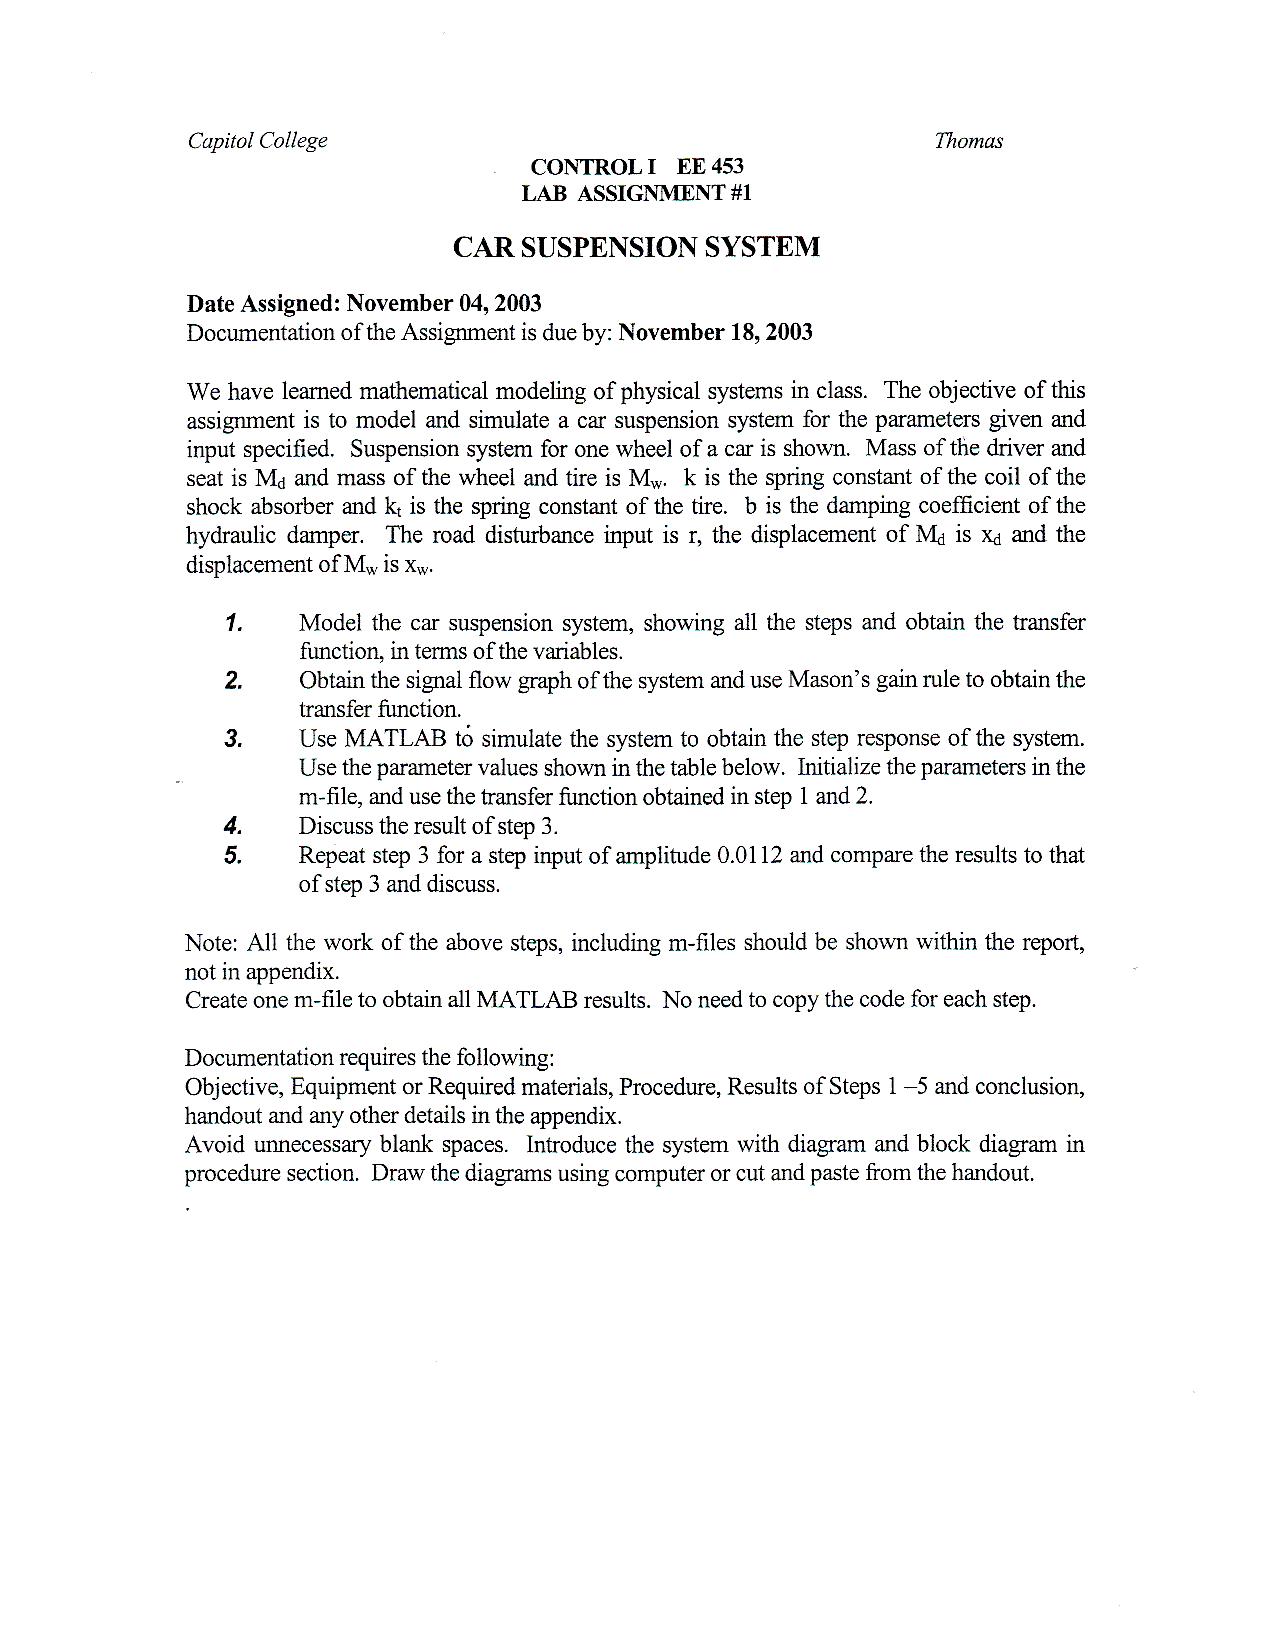
The objective of this lab is to model the suspension system of a car over an arbitrary terrain using MatLab® or similar software. The various coefficients for the system will be given. The system will be modeled and a transfer function will be obtained both directly and by using Mason's Gain Rule. A unit step function will be applied to the system modeled in MatLab® and the resulting displacement of the wheel and vehicle will be observed.
![]() Components
Used
Components
Used
1) PC with MatLab®, Octave®, SciLab® or equivalent.
![]() Procedure
Procedure
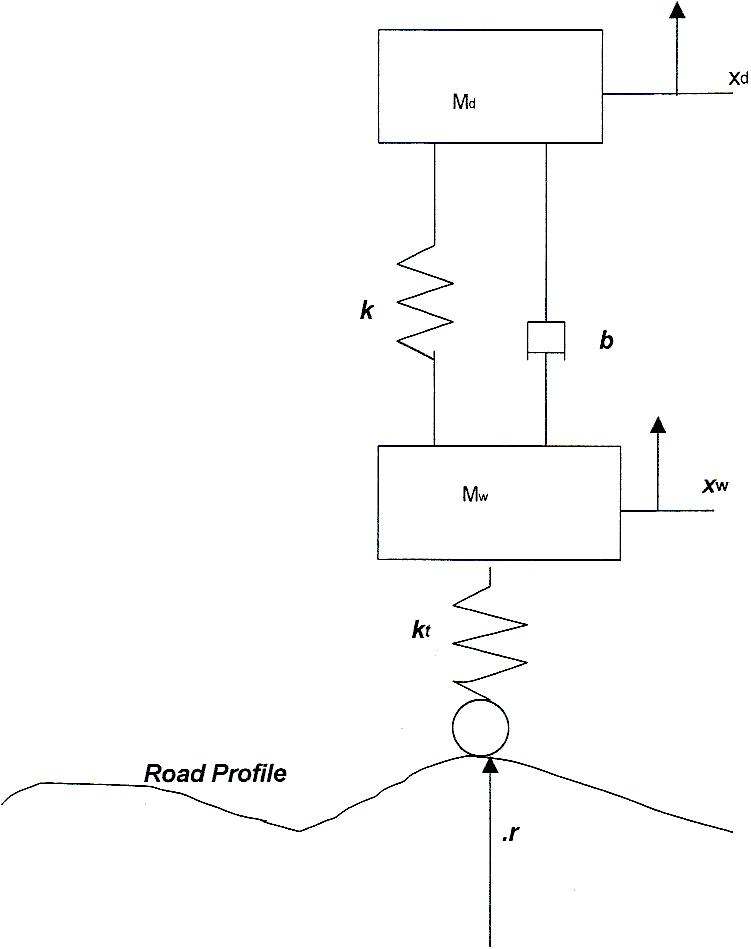
1) Given values, model a vehicle suspension system in the Laplace domain.
2) Obtain the transfer function to describe the displacement of the wheel and the vehicle body.
3) Obtain the signal flow graph of the system.
4) Using the Signal Flow Graph and Mason's gain rule, obtain the transfer function of the system.
5) Using MatLab®, or equivalent, graph the step response of the system.
6) Repeat step 4 using a step amplitude of .0112 and compare the results.
![]() Lab
Data / Results
Lab
Data / Results
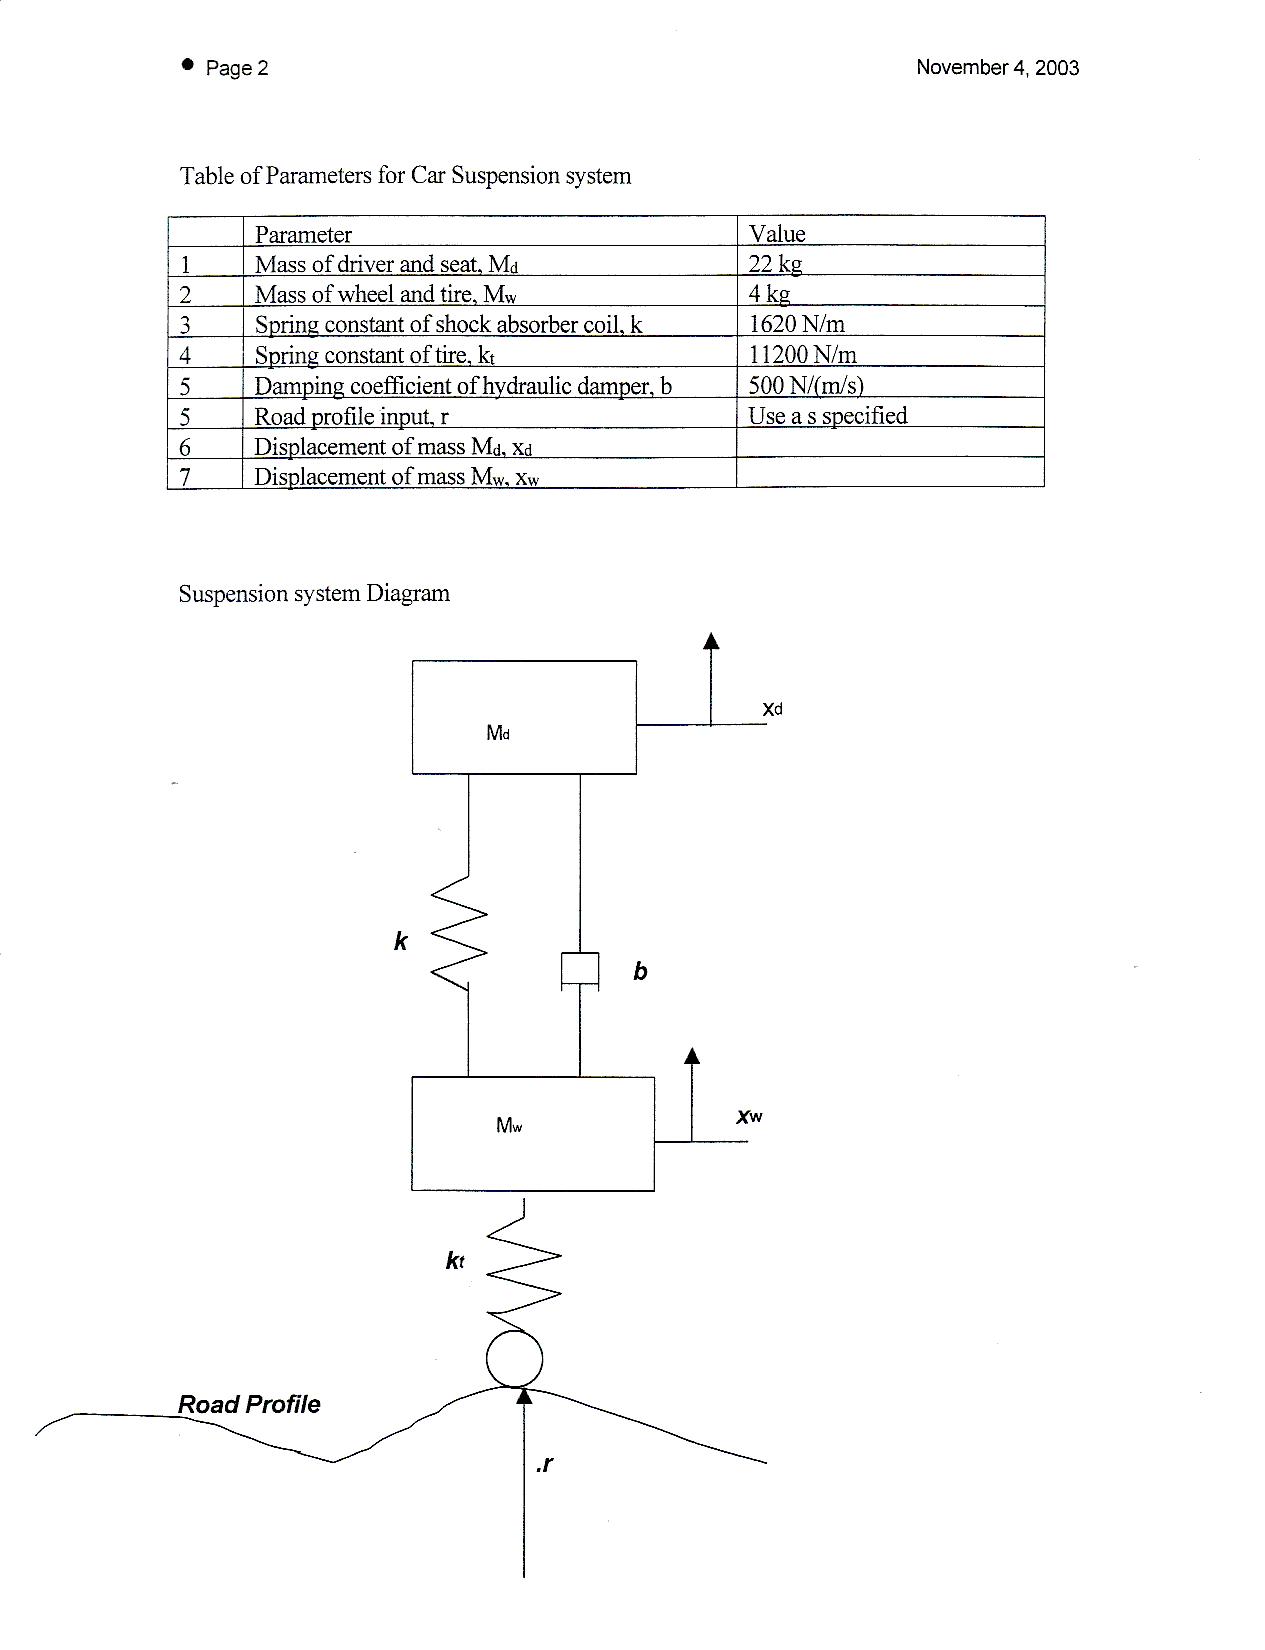
1) Table 1: Car Suspension System Data
|
Parameter |
Value |
|---|---|
|
Vehicle Mass (Md) |
22Kg |
|
Mass of Wheel (Mw) |
4Kg |
|
Spring Constant of Shock Absorber (k) |
1620N/m |
|
Spring Constant of Tire (kt) |
11200N/m |
|
Damping Coefficient of Hydraulic Damper (b) |
500Ns/m |
2) Diagram 1: System
3) Table 2: Transfer Functions
|
Transfer: |
|
Function: |
|---|---|---|
|
G(s) |
= |
Xd(s)/R(s) |
|
Xd(s)/R(s) |
= |
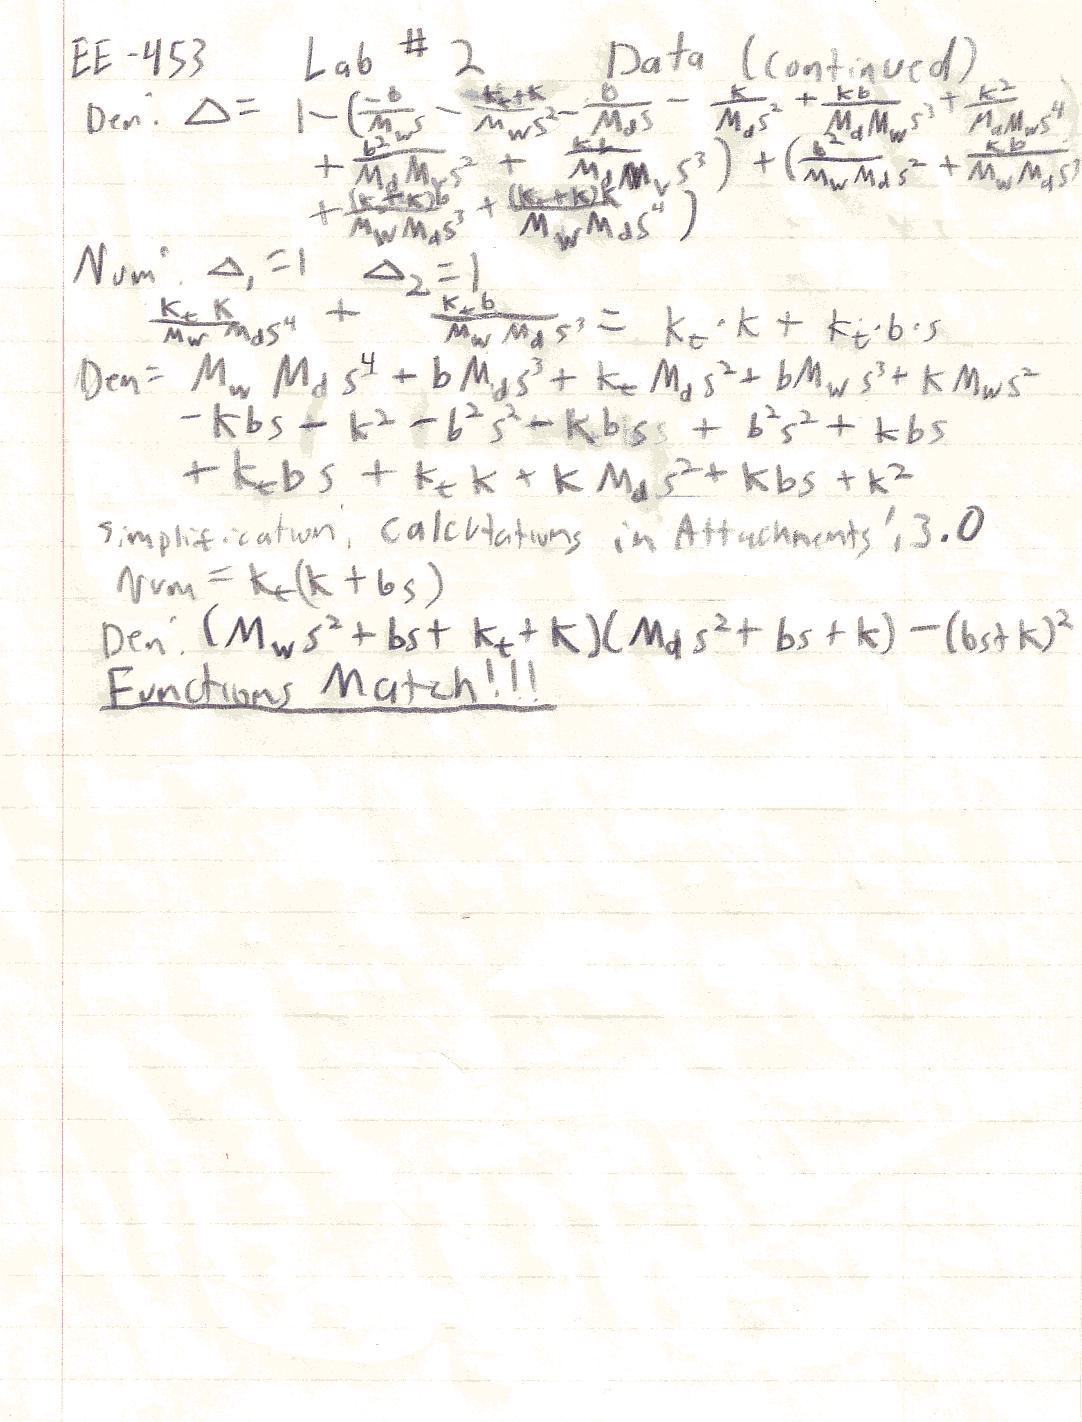
kt*(b*s + k)/((k + kt + b*s + Mw*s2)*(Md*s2 + b*s + k) – (b*s + k)2 |
|
Xw(s)/Xd(s) |
= |
(Md*s2 + b*s + k)/(b*s + k) |
4) Diagram 2: Signal Flow Graph
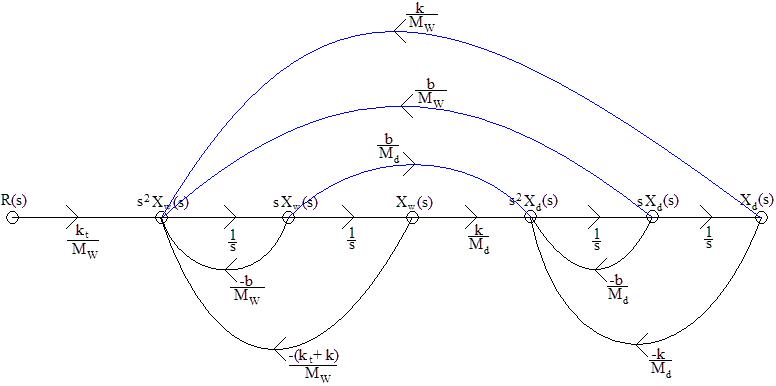
5) Table 3: Transfer Function from Signal Flow Graph
|
Transfer: |
|
Function: |
|---|---|---|
|
G(s) |
= |
kt*(k + b*s)/((Mw*s2 + b*s + kt + k)*(Md*s2 + b*s + k) – (b*s + k)2 |
6) Diagram 3: System Response to a Unit Step Input
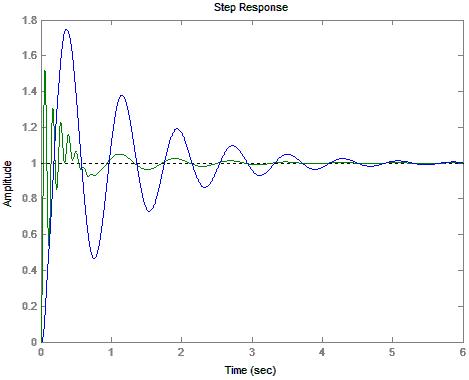
7) Diagram
4: Wheel Response to a Unit Step Input
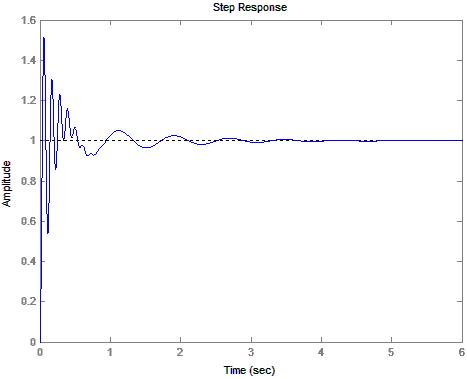
8) Diagram 5: Driver Response to a unit Step Input
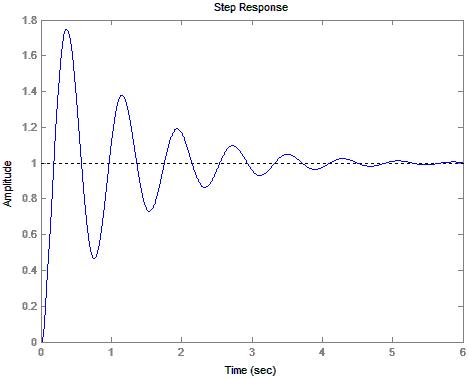
9) Diagram
6: System Response to a Unit Step Input of Amplitude .0112
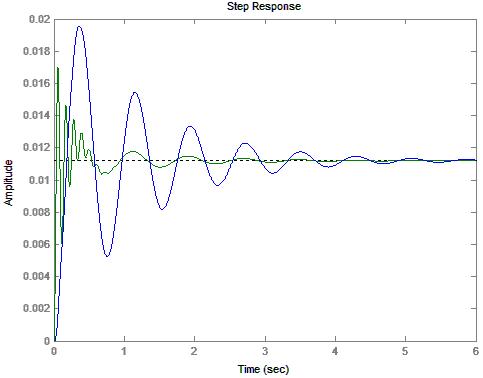
10) Diagram 7: Wheel Response to a Unit Step Input of Amplitude .0112

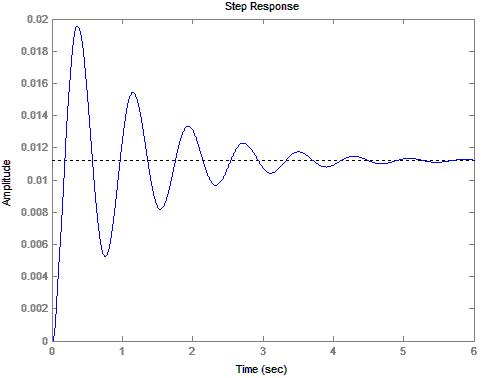
11) Diagram
8: Driver Response to a Unit Step Input of Amplitude .0112
![]() Conclusions
Conclusions
This lab has demonstrated that a system may be modeled both through Mason's gain rule as well as through the use of force diagrams. The transfer functions, after a significant amount of work, can be show to be equivalent. (Please refer to Attachments 3.1). Additionally, programs like MatLab® can be used to simulate the system. The effect of applying a .0112 unit step in step 6 caused a scaling factor to be applied to the transfer function. This in turn, scaled the responses. Although otherwise identical, the response was significantly smaller. This corresponds to things observed today. If you hit a large curb you're in for much more of a rough ride than if you roll over a small rock.
![]() Attachments
Attachments
