![]() Objective
Objective
This lab will demonstrate the ability to model a system using MATLAB®. A simple RLC filter will be used and the Laplace transform will be found. Using the Laplace transform, a unit step input will be applied. The result between analytically solving the output and the resulting output from MATLAB® will be compared.
![]() Components Used
Components Used
1) PC with MATLAB®, Octave® , or SciLab® installed.
![]() Procedures
Procedures
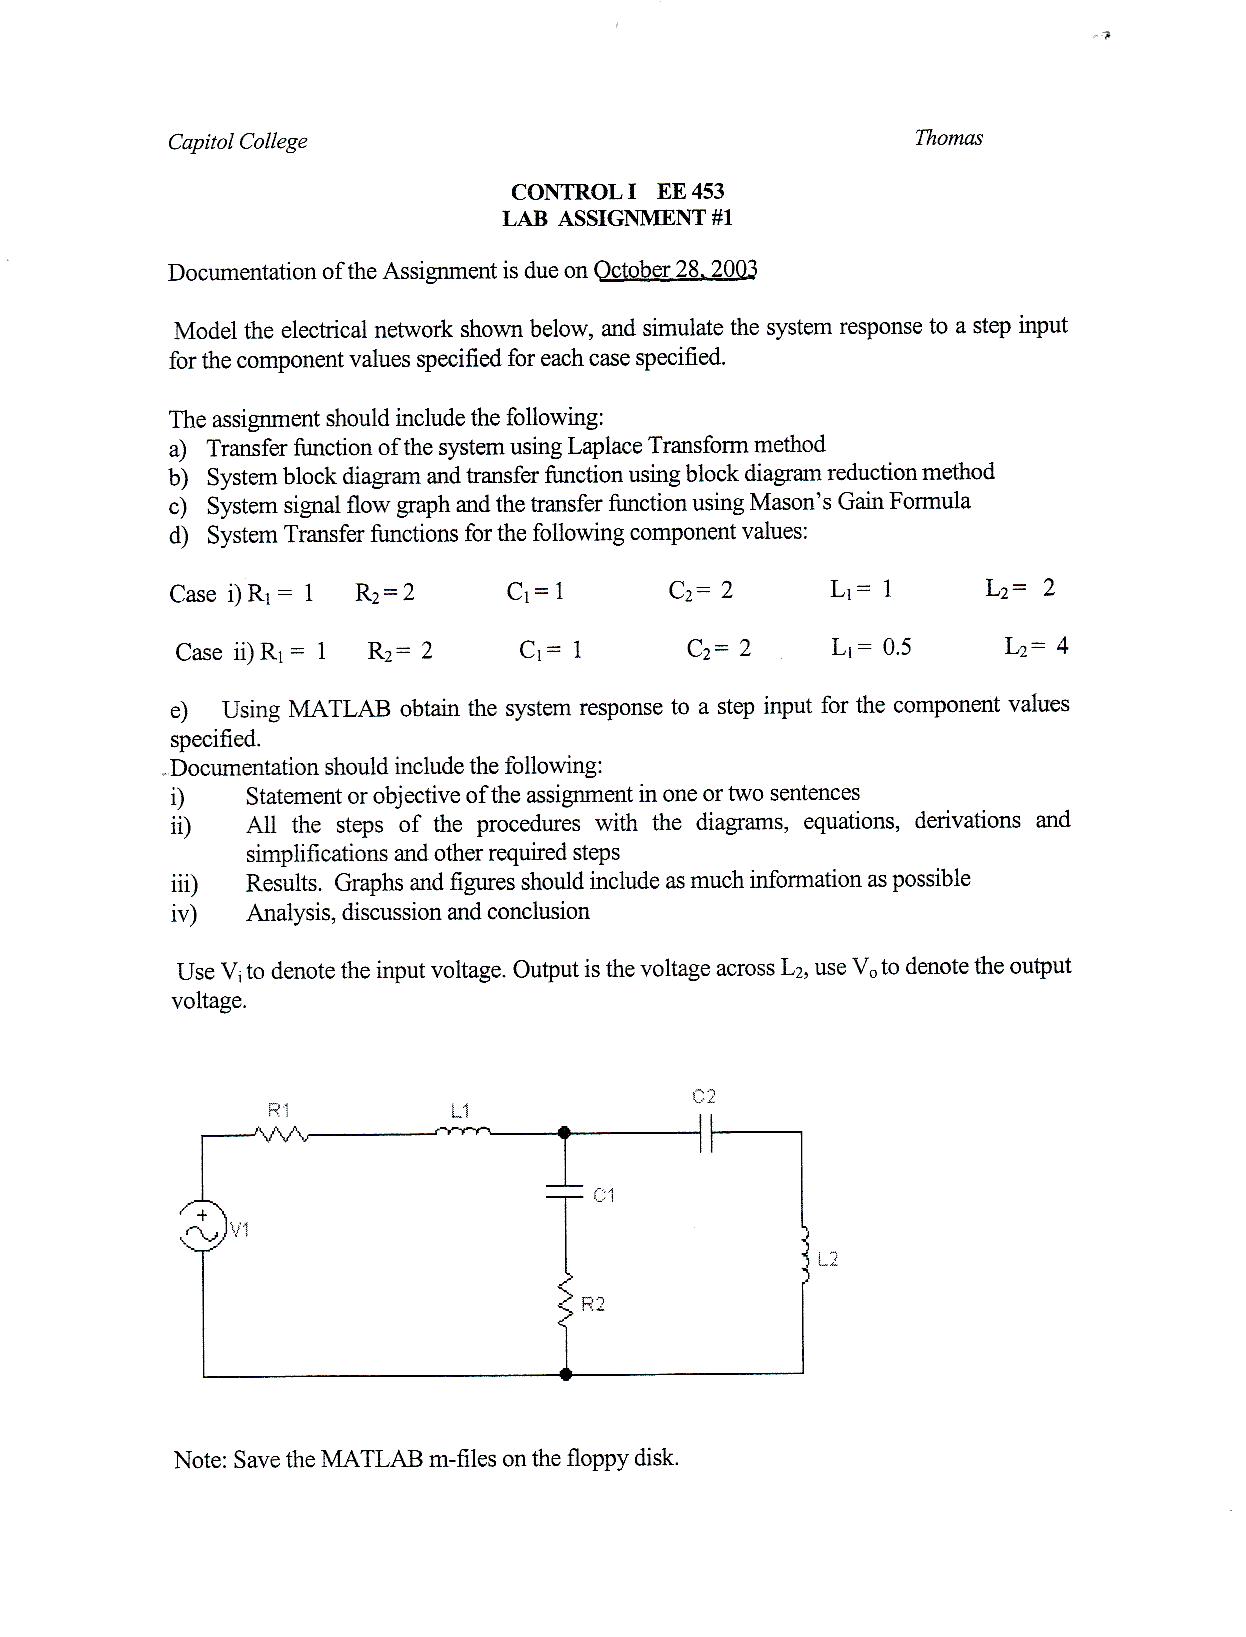
1) Obtain the transfer
function for the following system:
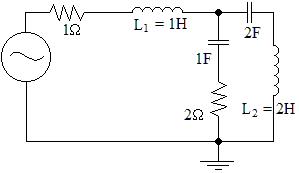
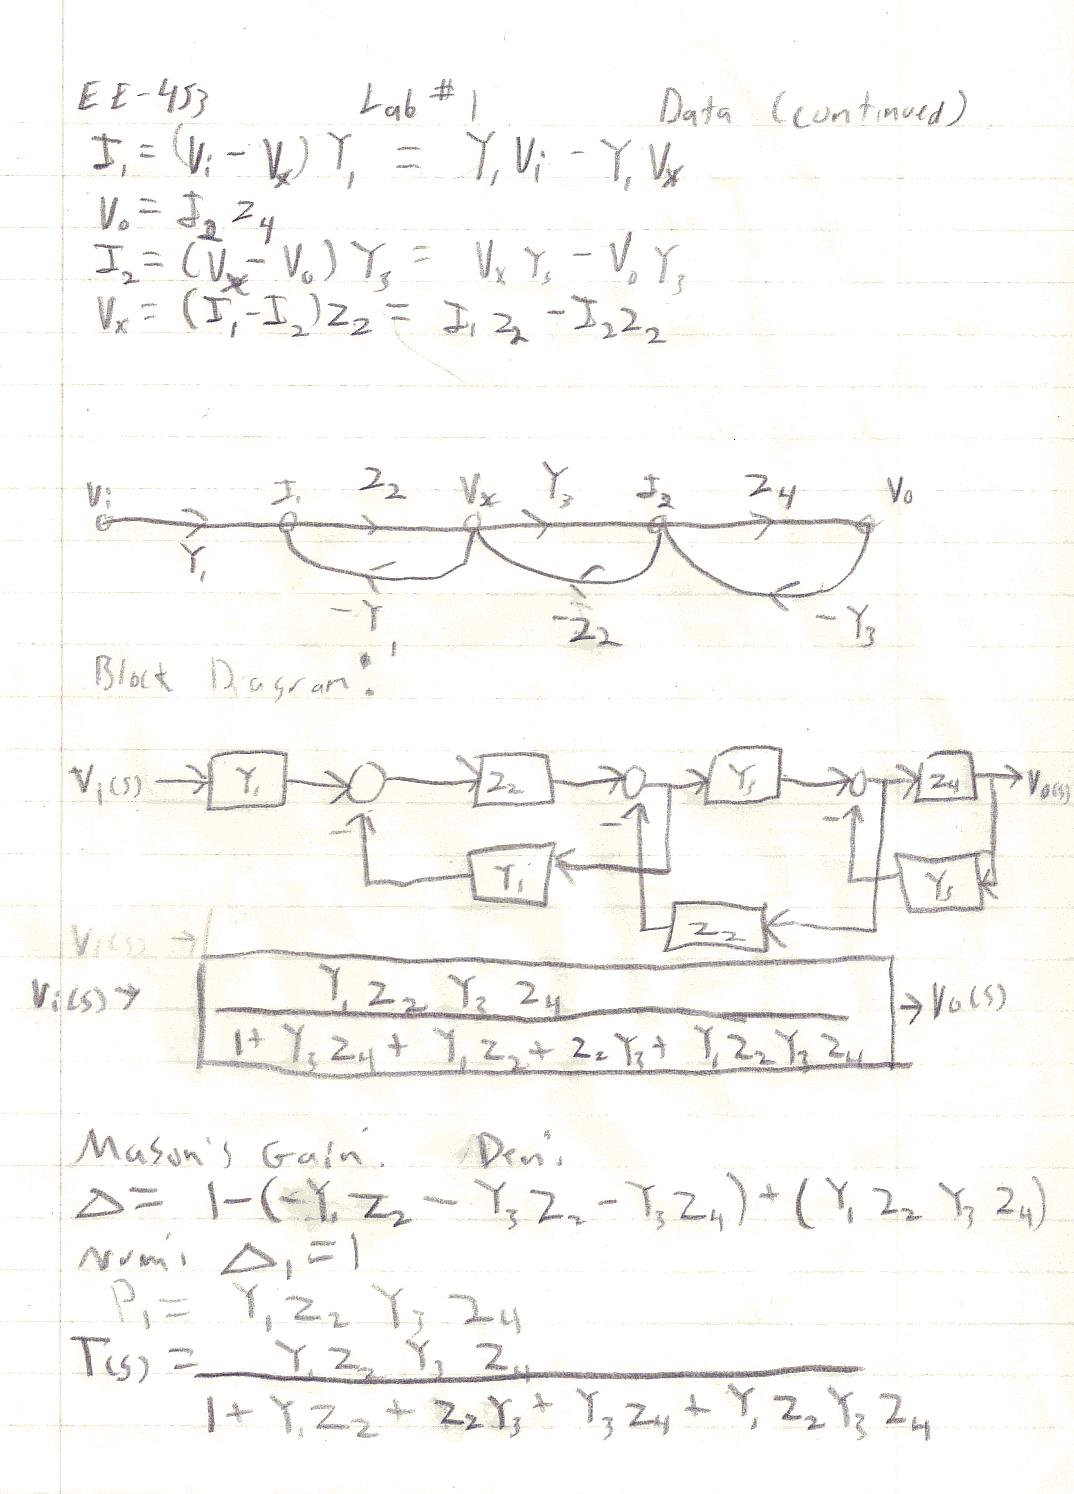
2) Illustrate the block diagram and transfer function of the system.
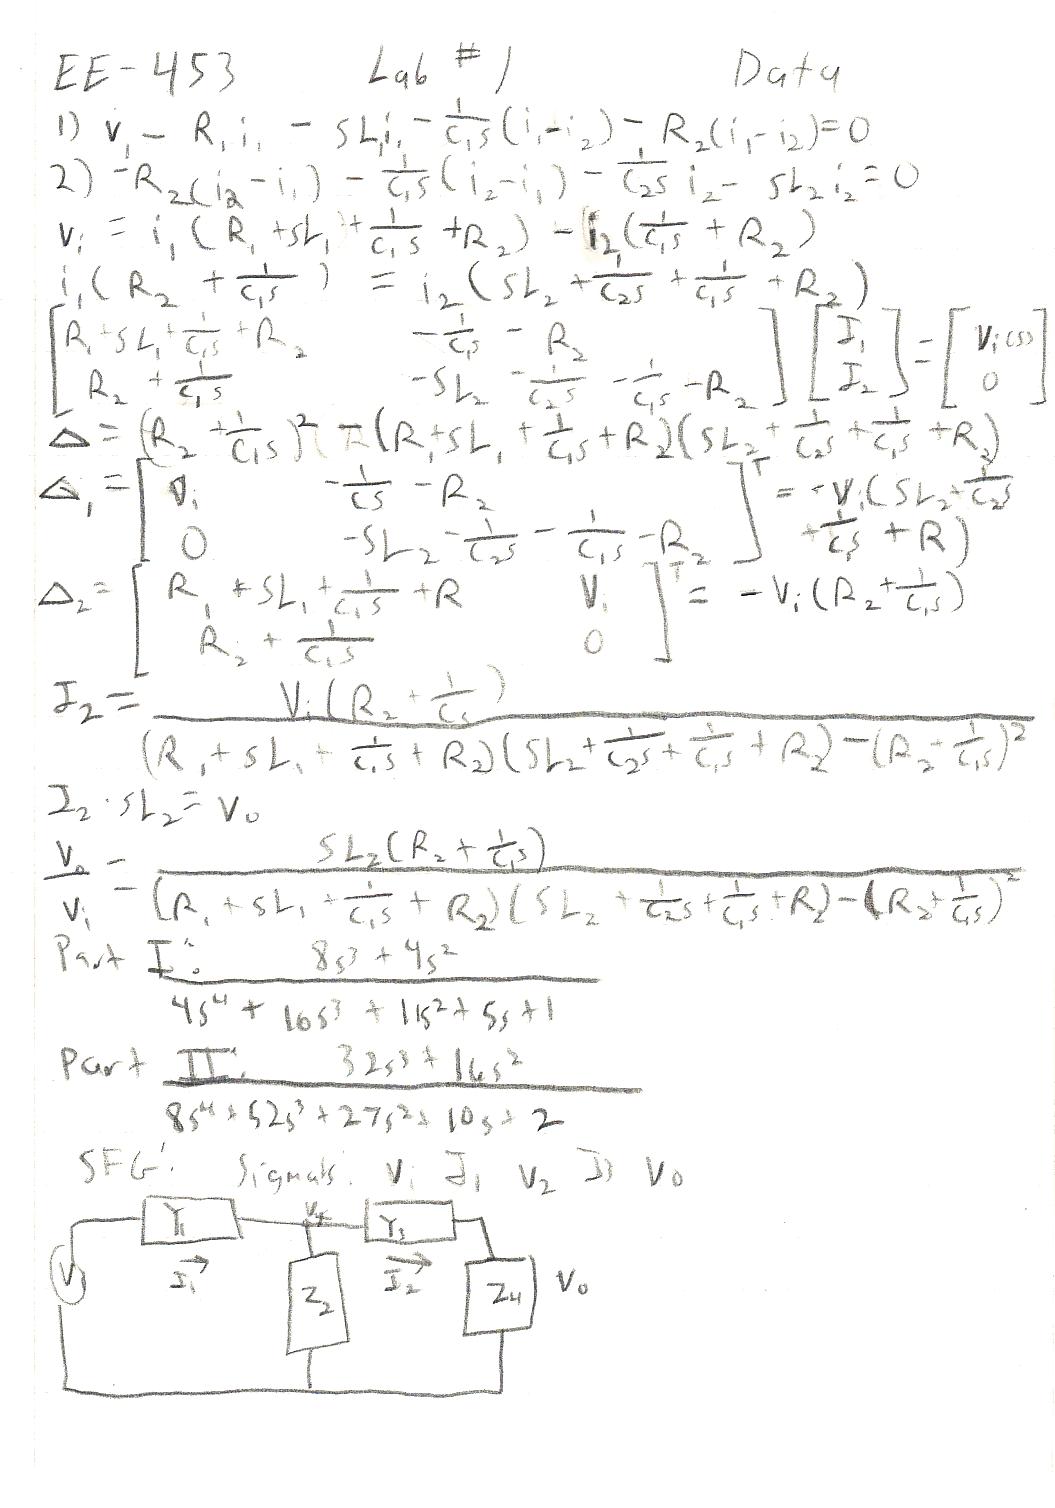
3) Calculate the theoretical output given a unit step function as the input.
4) Show the signal flow graph for the system.
5) Simulate the system to obtain the output.
6) Repeat steps 1 through 5 using L1 = .5H and L2 = 4H
![]() Lab
Data / Results
Lab
Data / Results
1) Diagram 1: Schematic Enlarged View

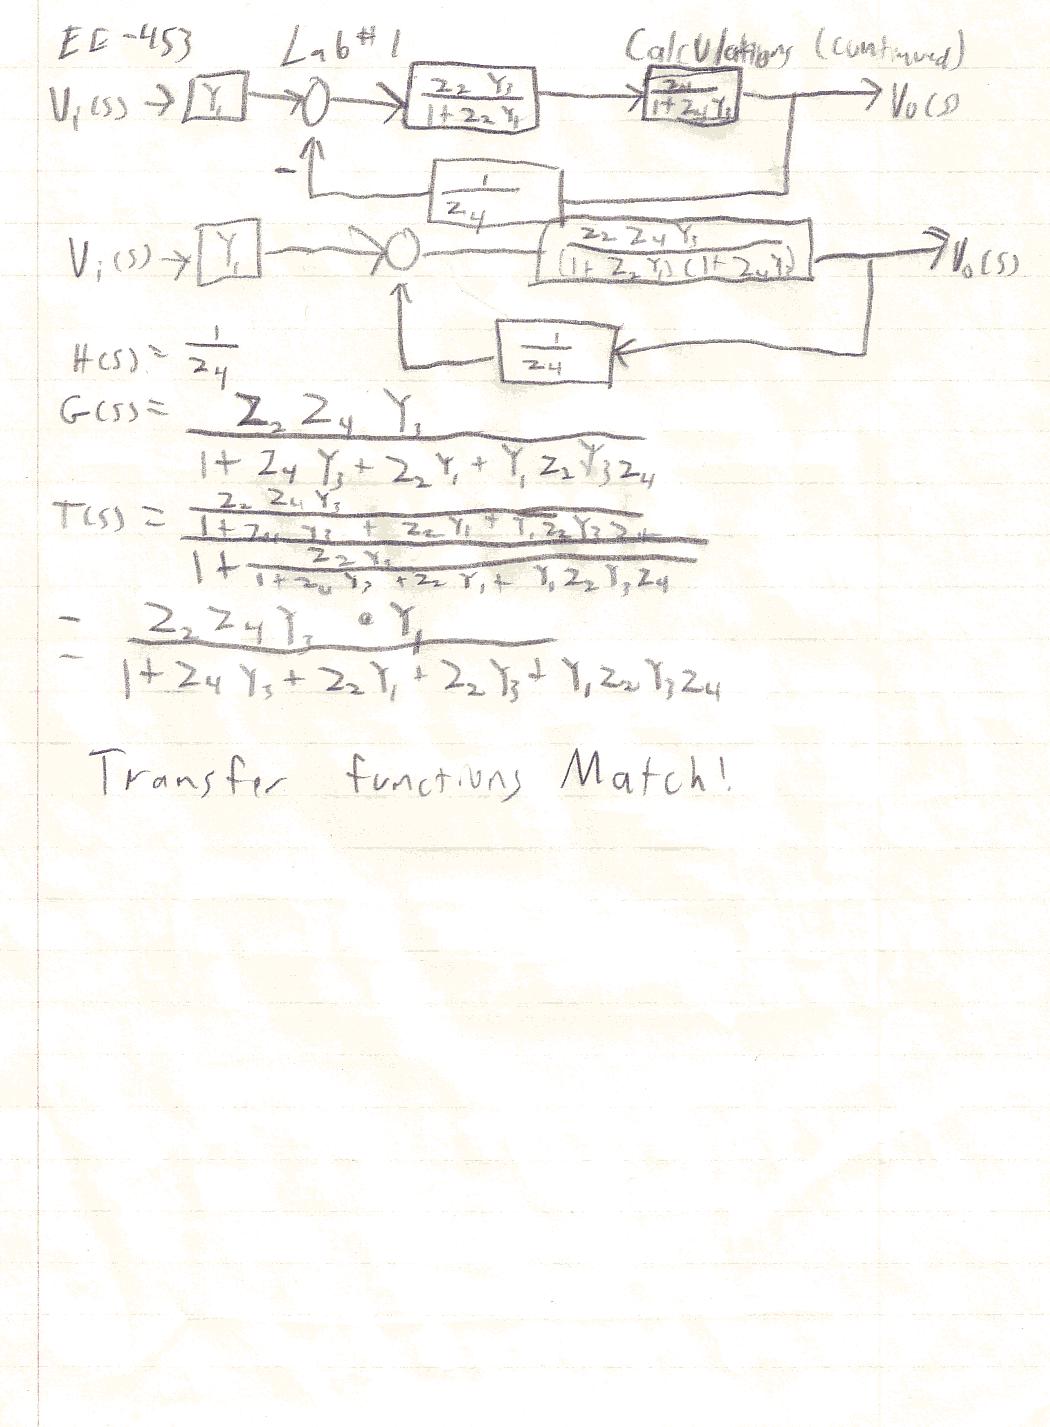
2) Diagram 2: Reduced Block Diagram of System

3) Diagram 3: Signal Flow Graph of System

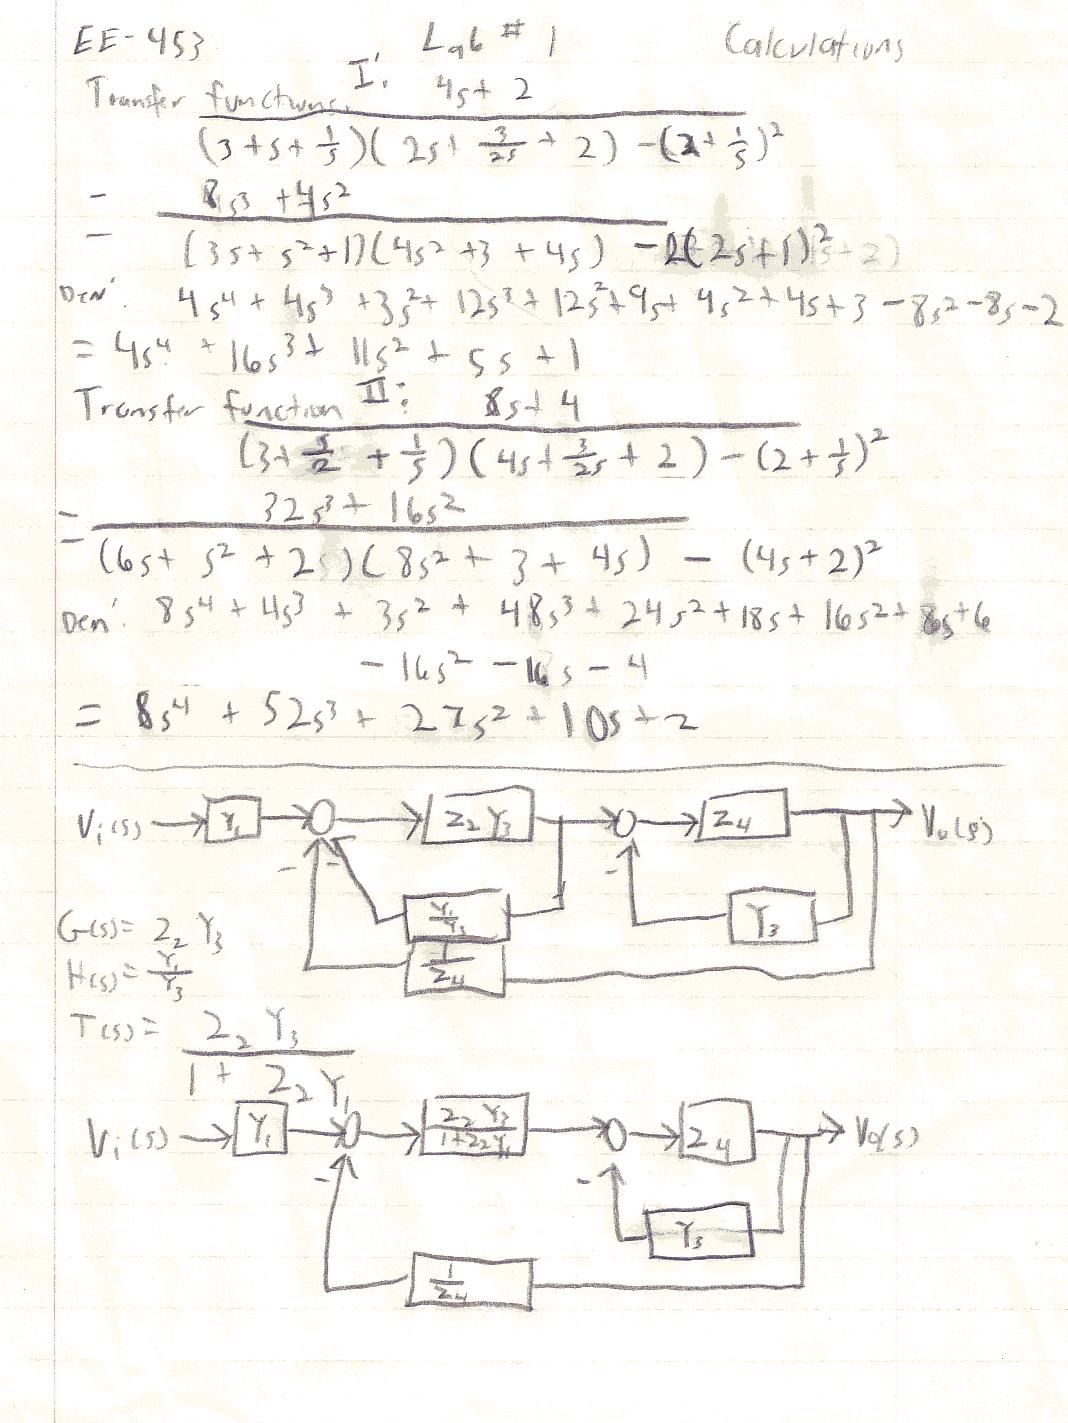
4) Table 1: Transfer Functions
|
Method: |
Transfer Function: |
|---|---|
|
Original Function: |
T(s) = (8s3 + 4s2)/(4s4 + 16s3 + 11s2 + 5s + 1) |
|
Step 6: |
T(s) = (32s3 + 16s2)/(8s4 + 52s3 + 27s2 + 10s + 1) |
|
Block Diagram Reduction: |
T(s) = Y1Z2Y3Z4/(1 + Y1Z2 + Z2Y3 + Y3Z4 + Y1Z2Y3Z4) |
|
Mason's Gain Rule: |
T(s) = Y1Z2Y3Z4/(1 + Y1Z2 + Z2Y3 + Y3Z4 + Y1Z2Y3Z4) |
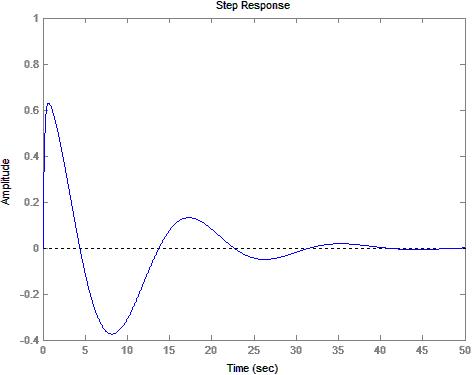
5) Diagram 4: Output From Step 5
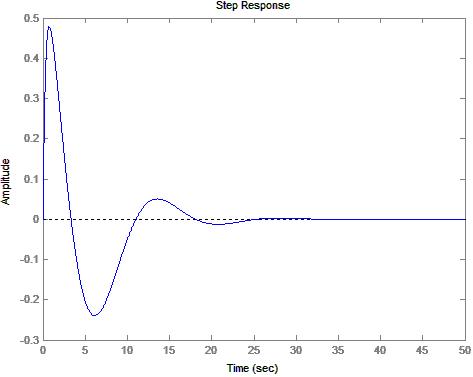
6) Diagram
5: Output From Step 6
![]() Conclusions
Conclusions
This lab has demonstrated three different ways in which the transfer function of a system can be obtained. One method is to use mesh analysis. Another method is to use block diagram reduction. A third method is to use signal flow representations of the system and use Mason's gain rule to obtain the transfer function. Additionally, this lab has demonstrated the ability of the control toolbox available for MatLab® to model a system using only the transfer function. The resulting output is expected and passes all of the sanity checks for signal passing and blocking at steady state. Although there is no direct proof that the two forms of the transfer function are equivalent, they appear to have the same characteristics when modeled. Overall, this lab has been successful at modeling a system.
![]() Attachments
Attachments
