![]() Objective
Objective
This lab will demonstrate the transmission of a digital signal in the presence of noise. To accomplish this, a digital signal will be simulated, and a noise signal will be simulated. Then the two signal will be added and the signal will be decoded and bit-errors will be counted. The number of bit-errors will then be compared to an expected valued generated using "Q" functions. Various methods of digital modulation will be employed to show the advantages and disadvantages of various modulation techniques.
![]() Components Used
Components Used
1) PC with Octave installed.
![]() Procedures
Procedures
1) Simulate a plain digital signal in the presence of noise by using the command "digital(sd,M)" where sd is the standard deviation and M is the expansion factor.
2) Use 1 for sd and 4 for M and record the results.
3) Repeat step 2 using 8 and 16 for M.
4) Repeat steps 1 through 3 using sd = 2, 4.
5) Using the "ook(sd,M)" command, simulate an OOK modulated digital signal.
6) Simulate the signal using sd = 1, 2, 4 M=4.
7) Create a .m file that will simulate a signal using BPSK modulation.
8) Simulate a BPSK signal using M=8, sd=1, 2, 4.
9) Repeat steps 6 and 7 using QPSK modulation.
![]() Lab
Data / Results
Lab
Data / Results
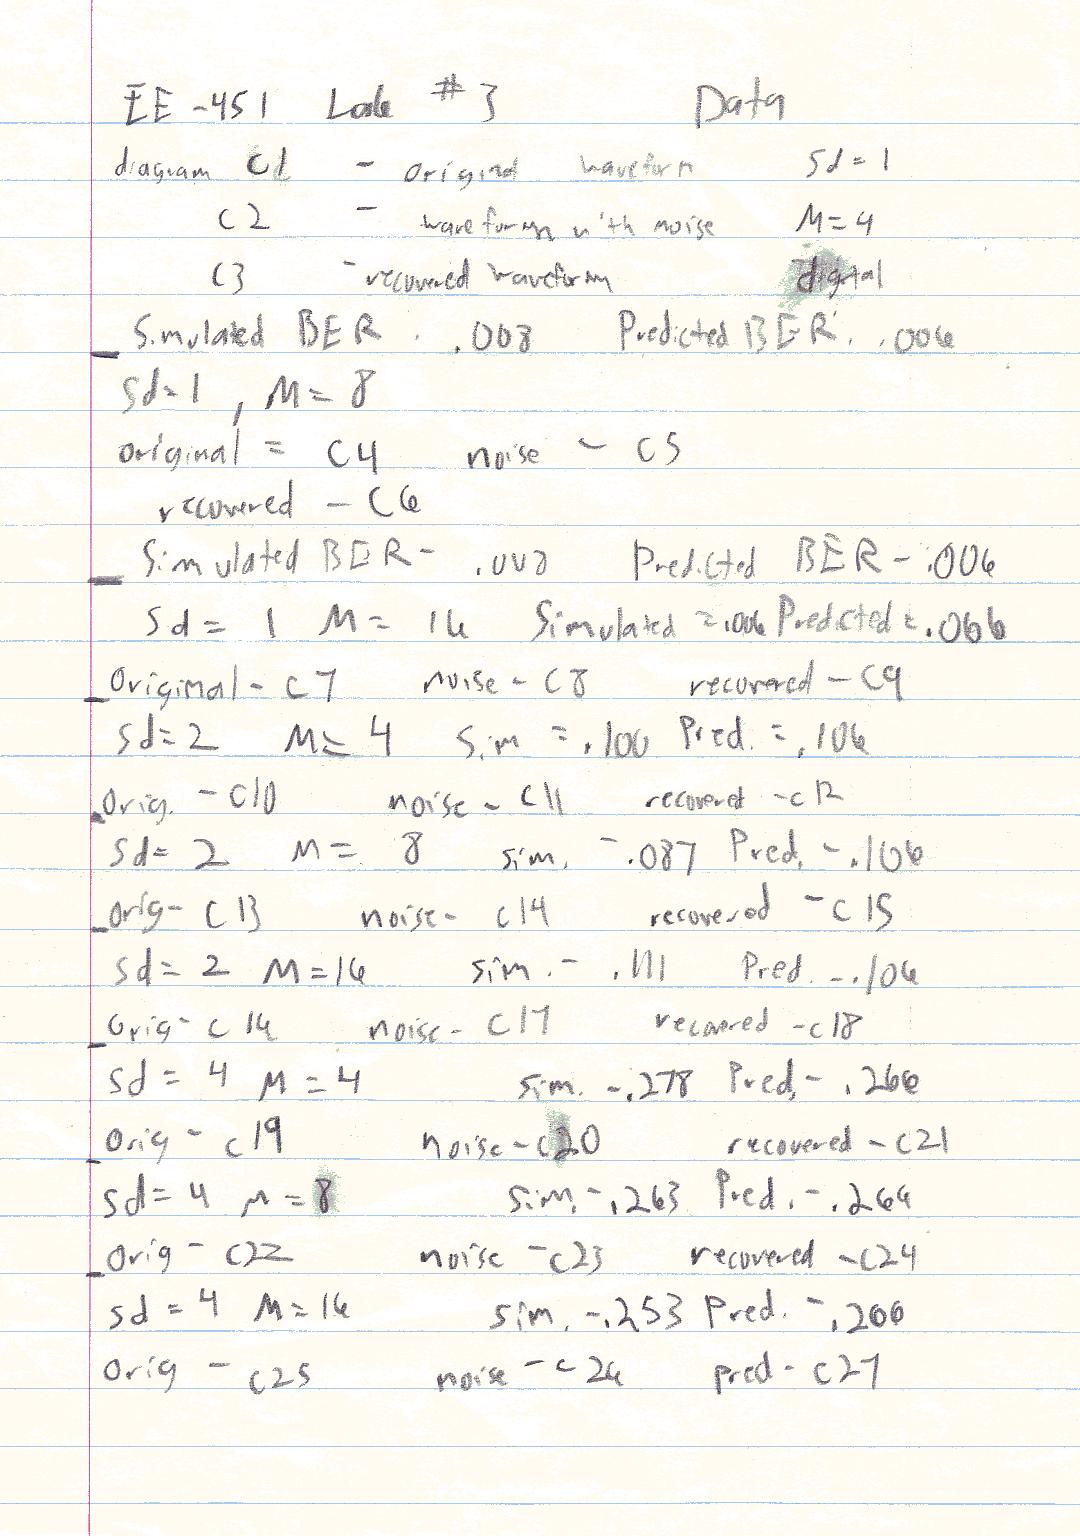
1) Table 1: Bit Error Rates:
|
Modulation Technique |
M |
RMS Noise Voltage |
Expected BER |
Observed BER |
% Error |
|---|---|---|---|---|---|
|
TTL |
4 |
1v |
.006 |
.008 |
33.3% |
|
TTL |
8 |
1v |
.006 |
.008 |
33.3% |
|
TTL |
16 |
1v |
.006 |
.008 |
33.3% |
|
TTL |
4 |
2v |
.106 |
.100 |
5.66% |
|
TTL |
8 |
2v |
.106 |
.111 |
4.72% |
|
TTL |
16 |
2v |
.106 |
.087 |
17.9% |
|
TTL |
4 |
4v |
.266 |
.278 |
4.51% |
|
TTL |
8 |
4v |
.266 |
.263 |
1.13% |
|
TTL |
16 |
4v |
.266 |
.253 |
4.89% |
|
OOK |
4 |
1v |
.000 |
.000 |
0% |
|
OOK |
4 |
2v |
.039 |
.052 |
33.3% |
|
OOK |
4 |
4v |
.188 |
.163 |
13.3% |
|
BPSK |
4 |
1v |
.000 |
.000 |
0% |
|
BPSK |
4 |
2v |
.000 |
.000 |
0% |
|
BPSK |
4 |
4v |
.039 |
.012 |
69.2% |
|
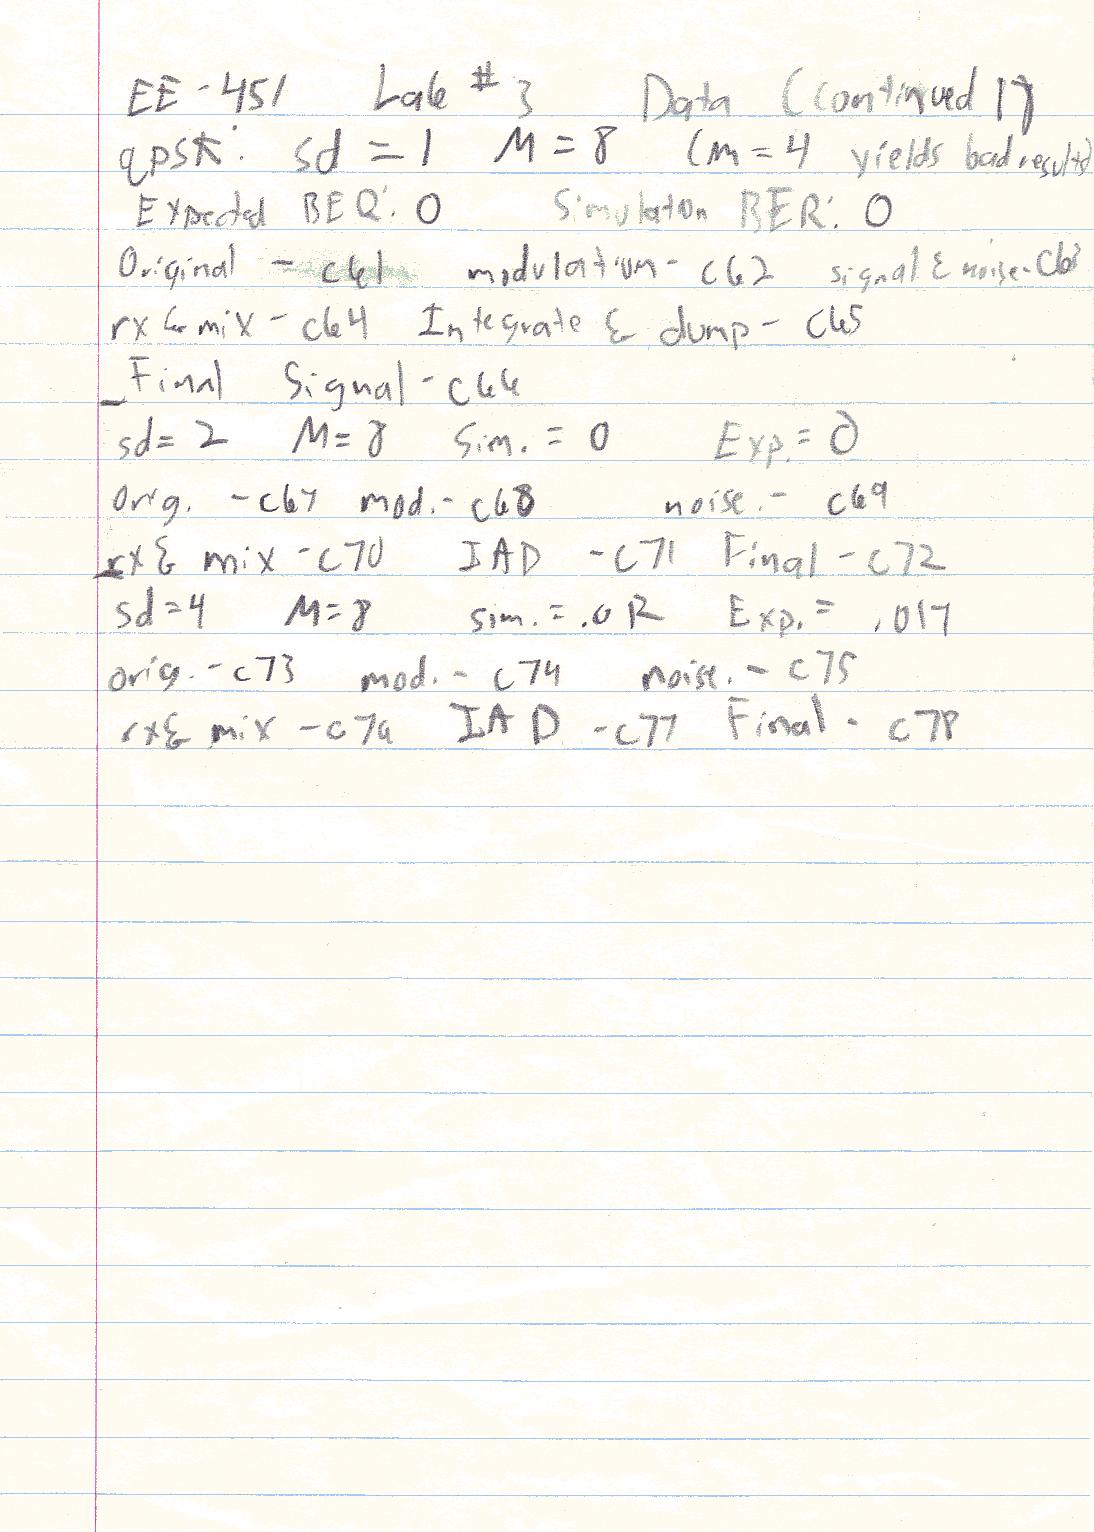
QPSK |
8 |
1v |
.000 |
.000 |
0% |
|
QPSK |
8 |
2v |
.000 |
.000 |
0% |
|
QPSK |
8 |
4v |
.012 |
.017 |
41.7% |
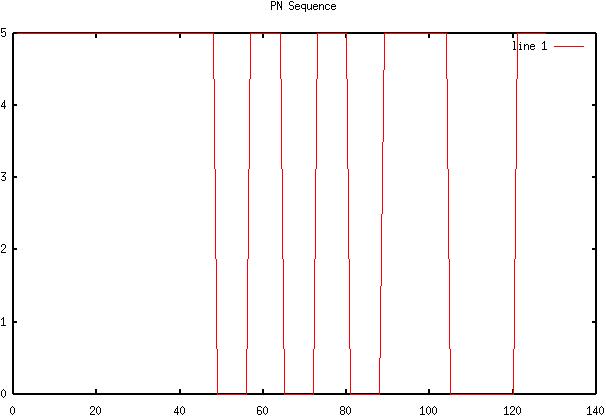
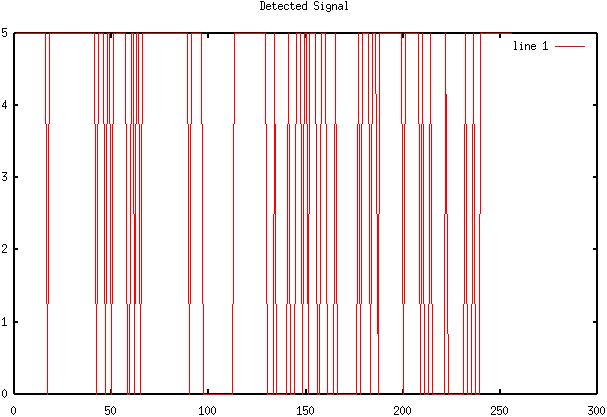
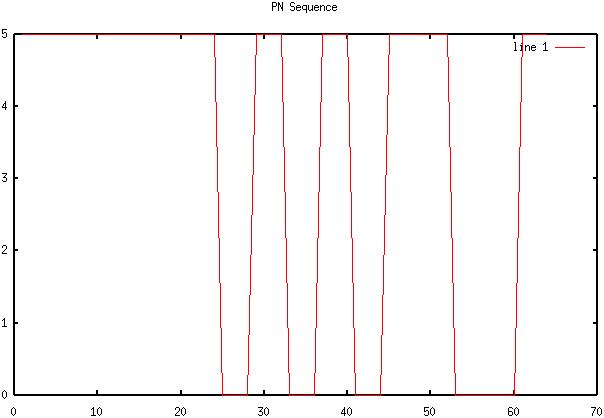
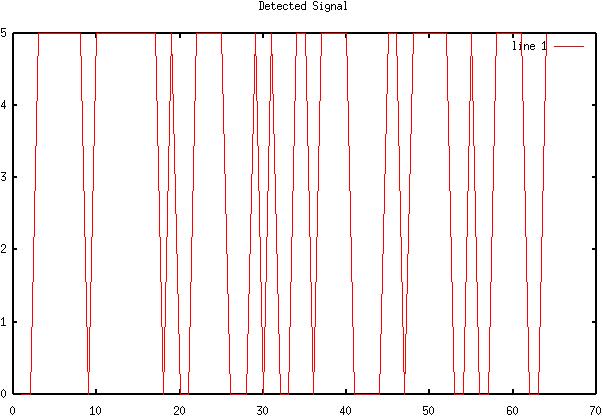
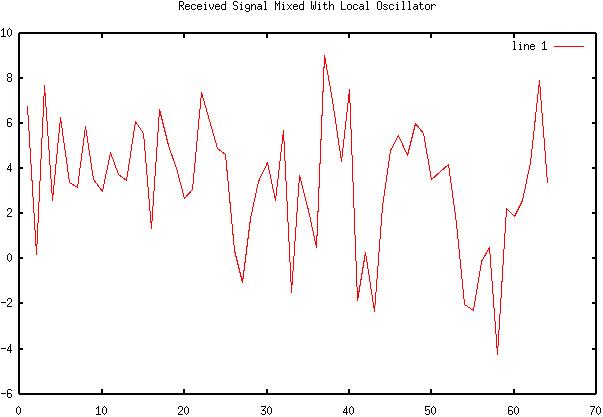
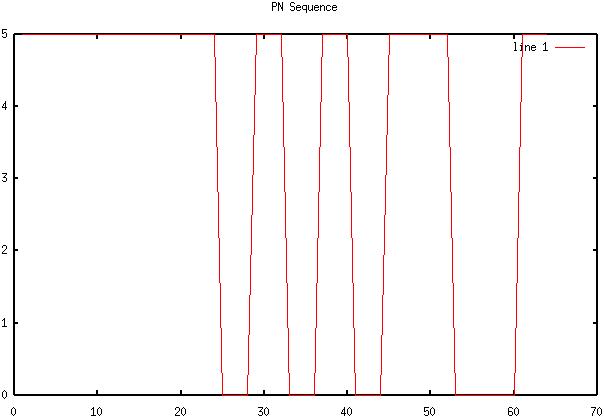
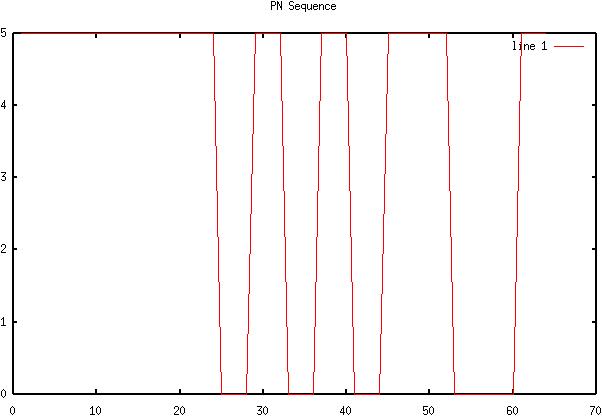
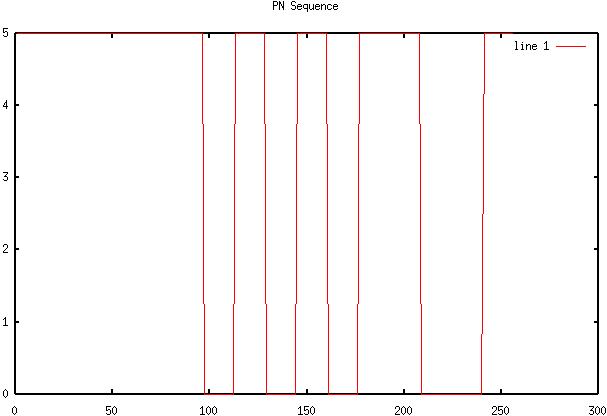
2) Diagram 1: Original TTL signal for M=4 sd = 1 digital transmission
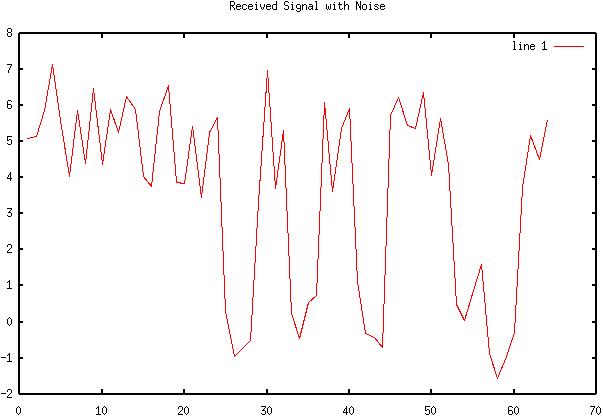
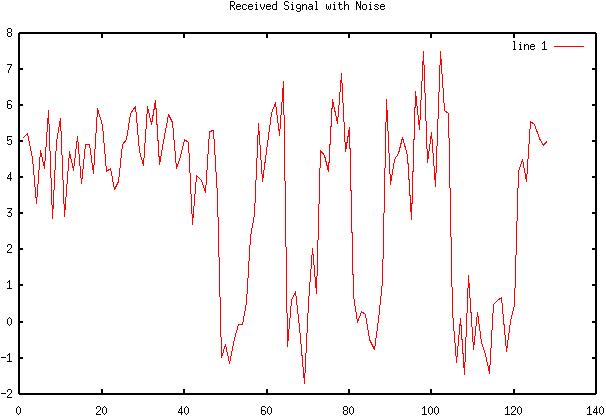
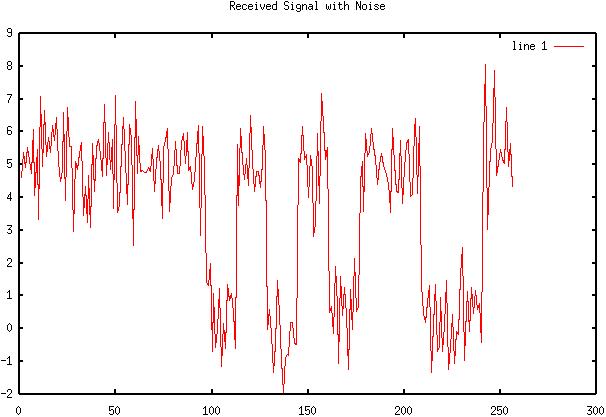
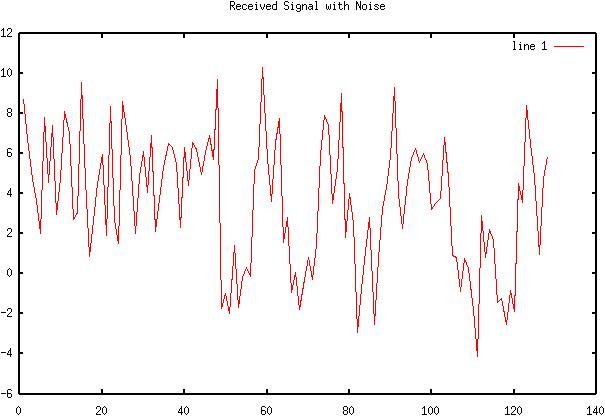
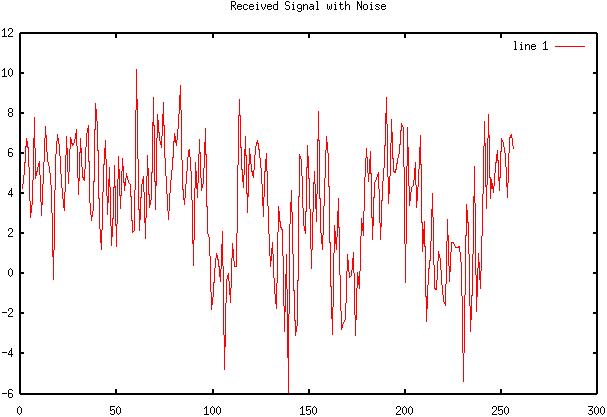
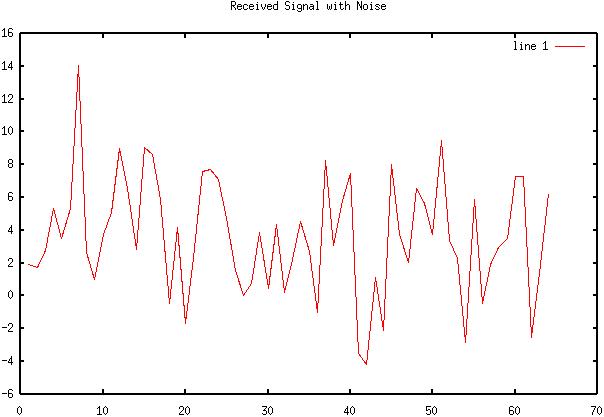
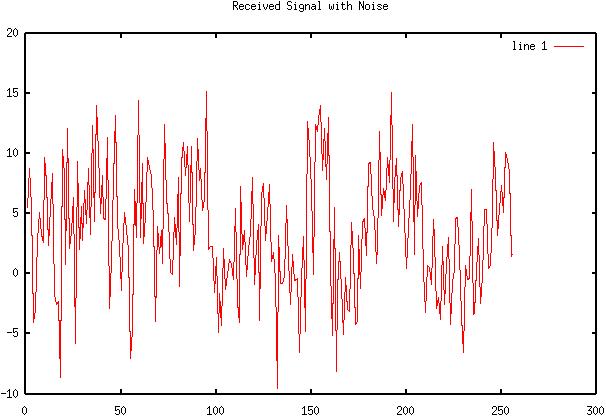
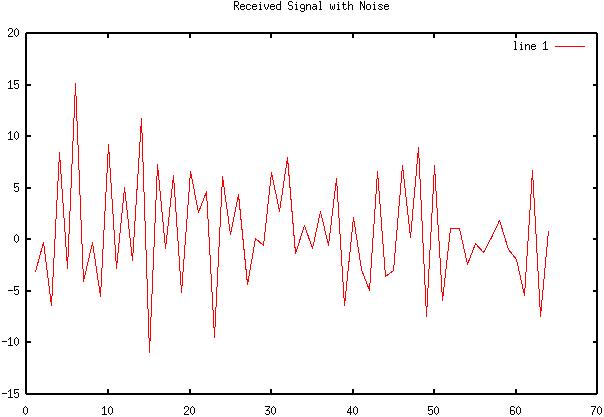
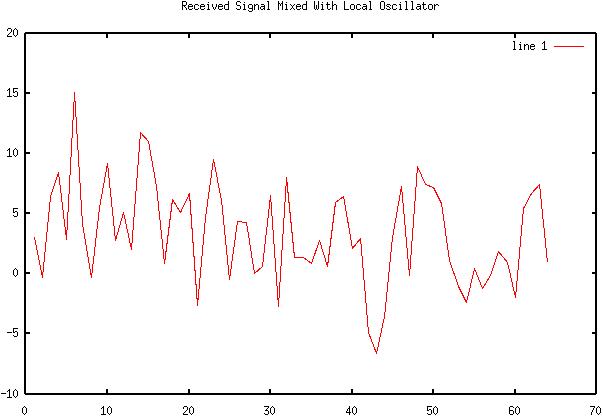
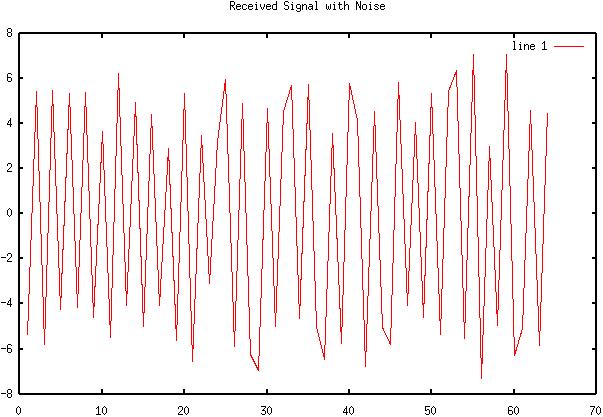
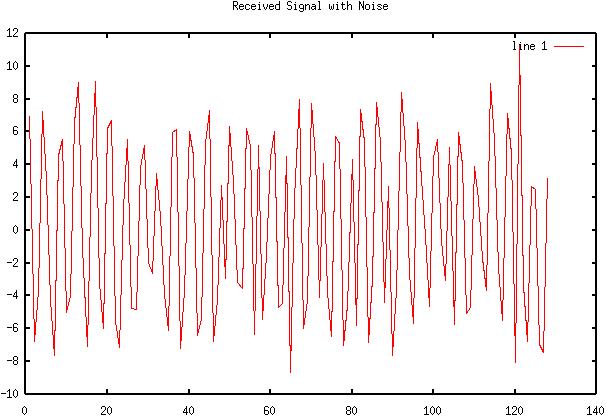
3) Diagram 2: Digital transmission with noise
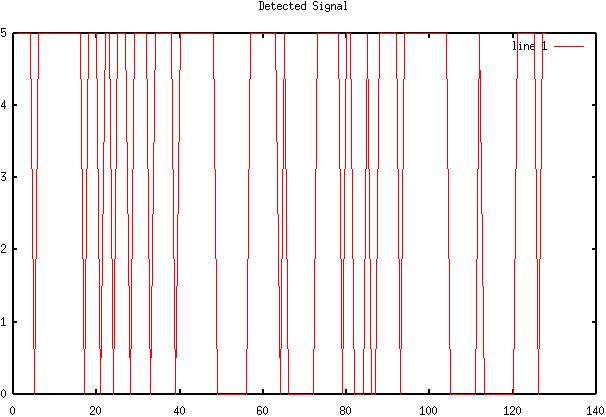
4) Diagram
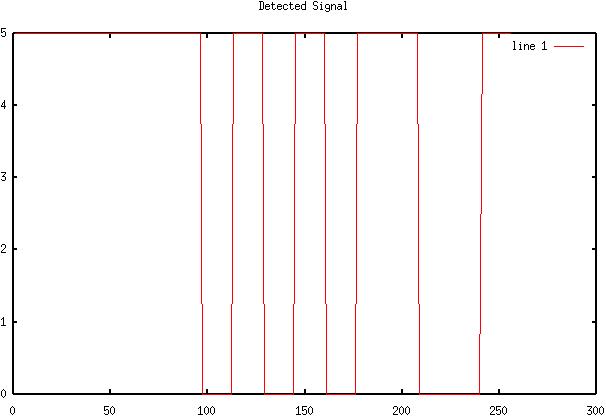
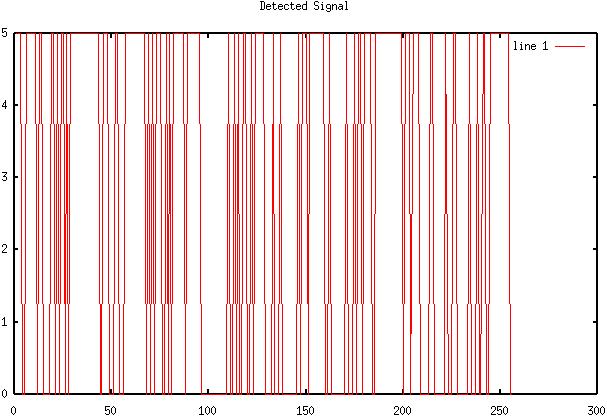
3: Recovered signal
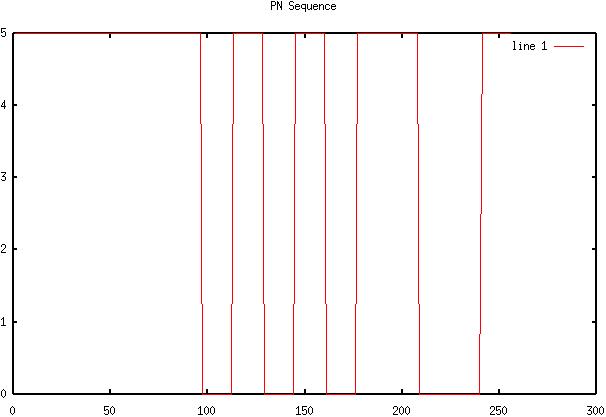
5) Diagram
4: Original TTL signal for M=8 sd = 1 digital transmission

6) Diagram
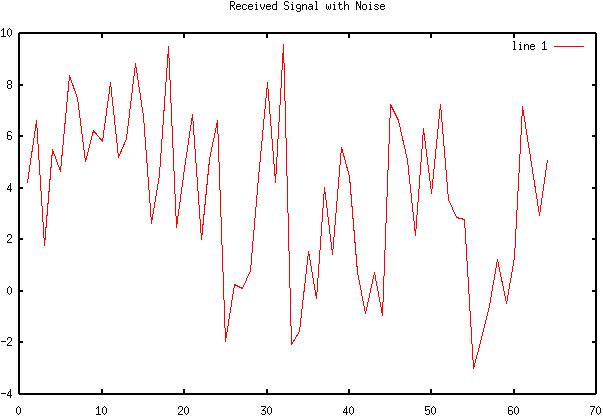
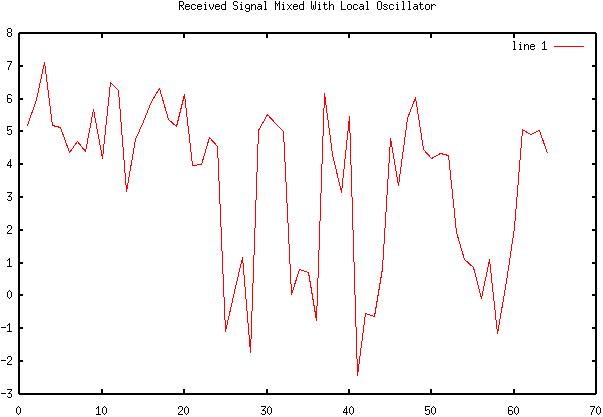
5: Digital transmission with noise
7) Diagram
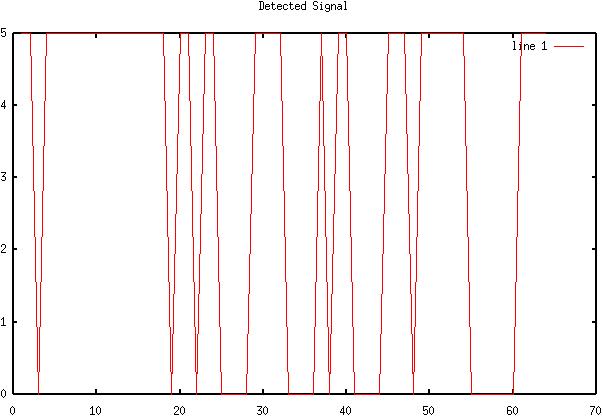
6: Recovered signal
8) Diagram
7: Original TTL signal for M=16 sd = 1 digital transmission

9) Diagram
8: Digital transmission with noise
10) Diagram
9: Recovered signal
11) Diagram
10: Original TTL signal for M=4 sd = 2 digital transmission

12) Diagram
11: Digital transmission with noise
13) Diagram
12: Recovered signal
14) Diagram
13: Original TTL signal for M=8 sd = 2 digital transmission
15) Diagram
14: Digital transmission with noise
16) Diagram
15: Recovered signal
17) Diagram
16: Original TTL signal for M=16 sd = 2 digital transmission
18) Diagram
17: Digital transmission with noise
19) Diagram
18: Recovered signal
20) Diagram
19: Original TTL signal for M=4 sd = 4 digital transmission
21) Diagram
20: Digital transmission with noise
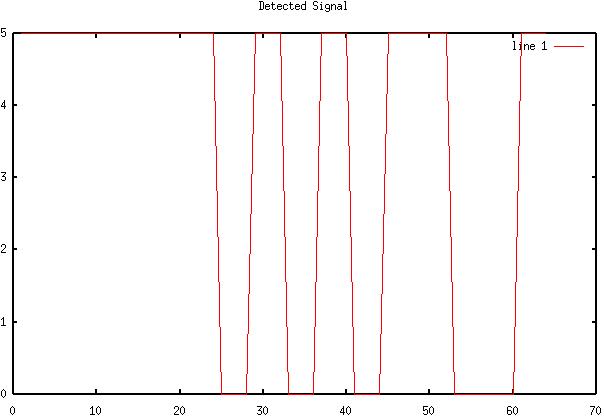
22) Diagram
21: Recovered signal
23) Diagram
22: Original TTL signal for M=8 sd = 4 digital transmission
24) Diagram
23: Digital transmission with noise
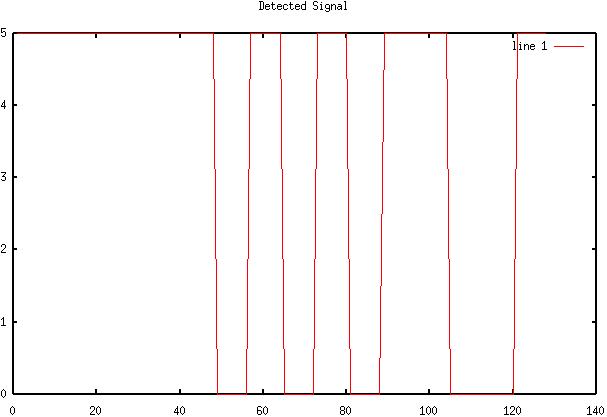
25) Diagram
24: Recovered signal
26) Diagram
25: Original TTL signal for M=16 sd = 4 digital transmission

27) Diagram
26: Digital transmission with noise
28) Diagram
27: Recovered signal
29) Diagram
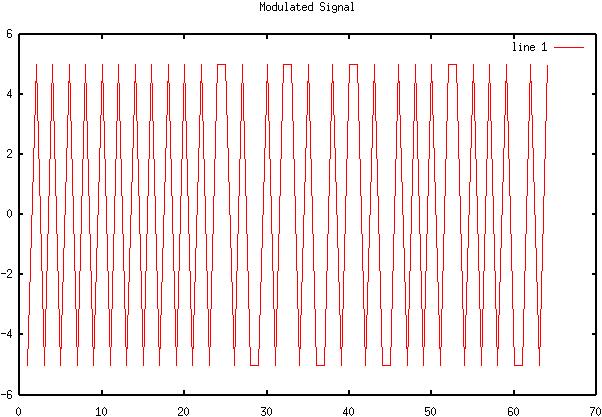
28: Original TTL signal for M=4 sd = 1 OOK transmission

30) Diagram
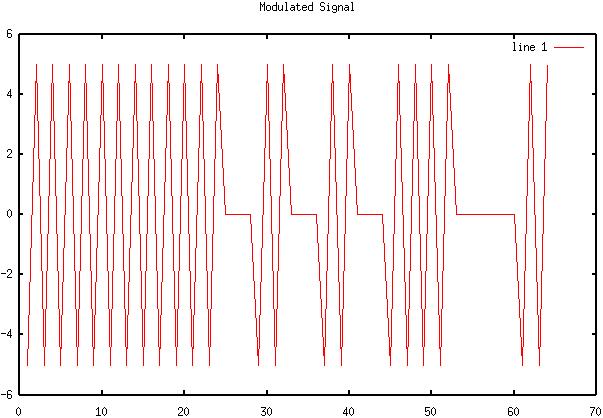
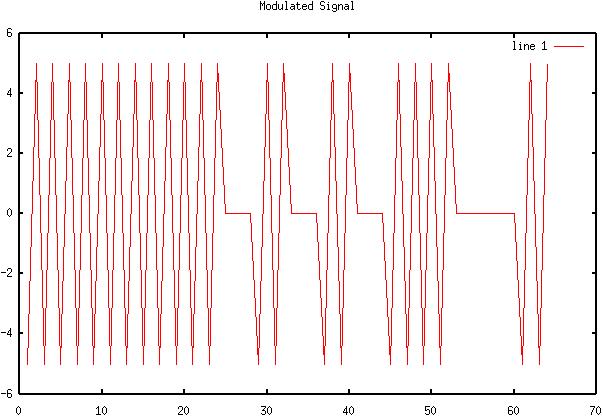
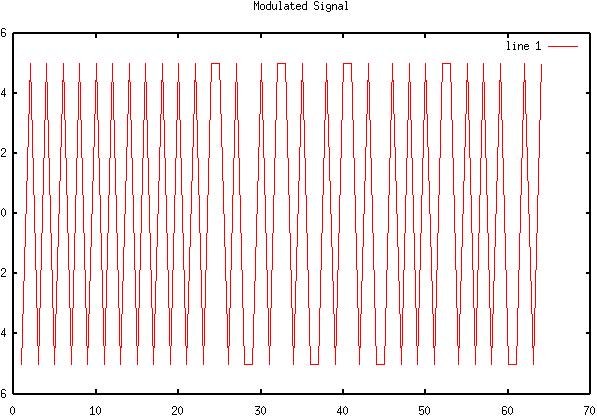
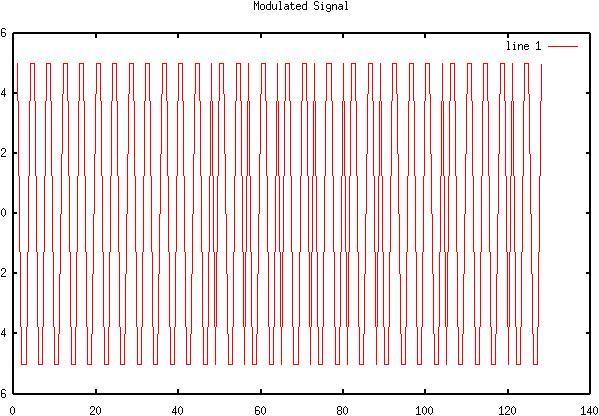
29: OOK Signal
31) Diagram
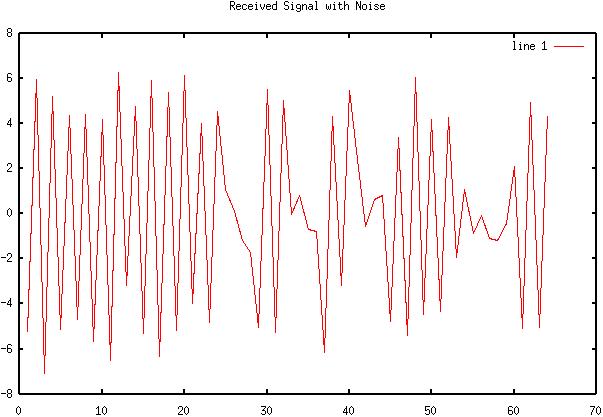
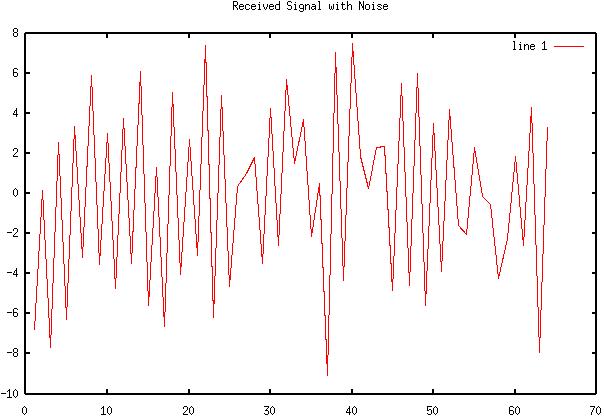
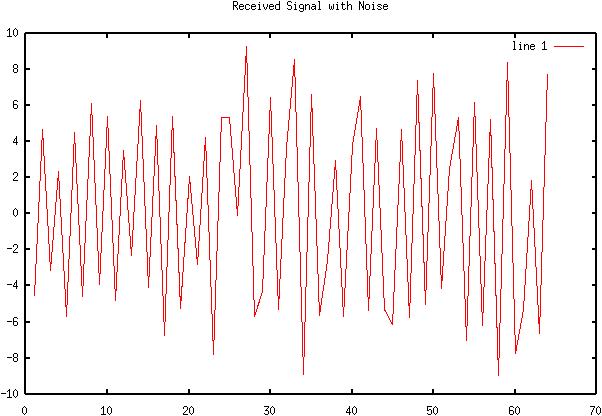
30: OOK Signal and noise
32) Diagram
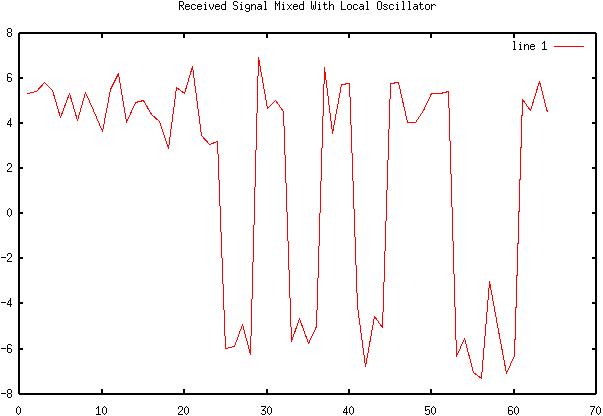
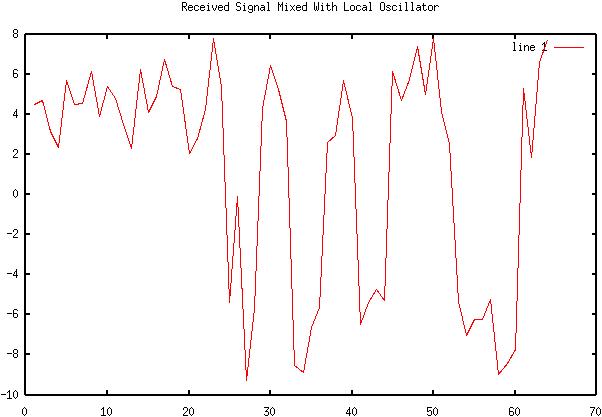
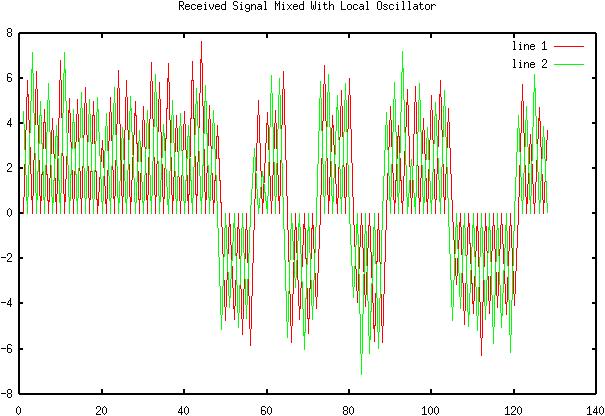
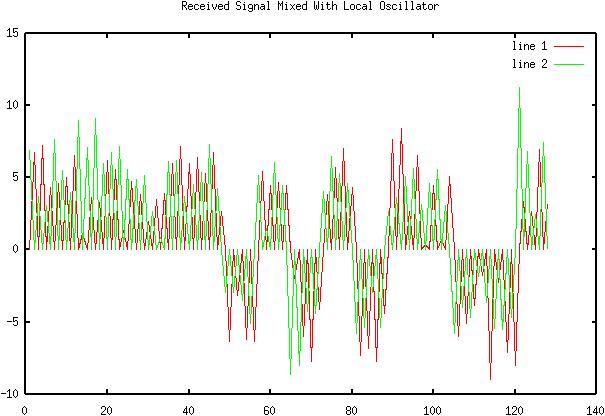
31: OOK Signal after mixing
33) Diagram
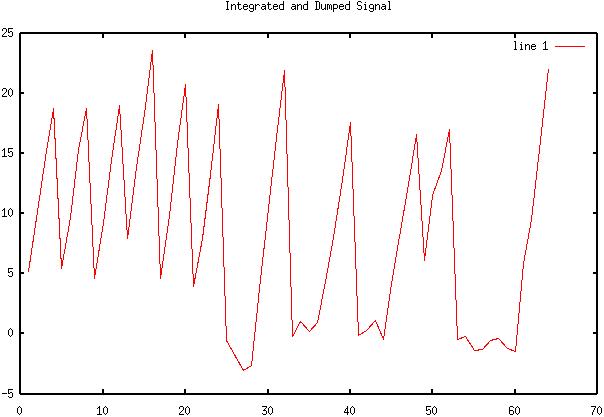
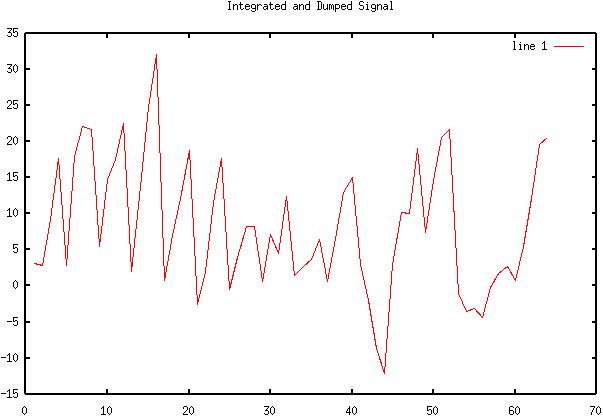
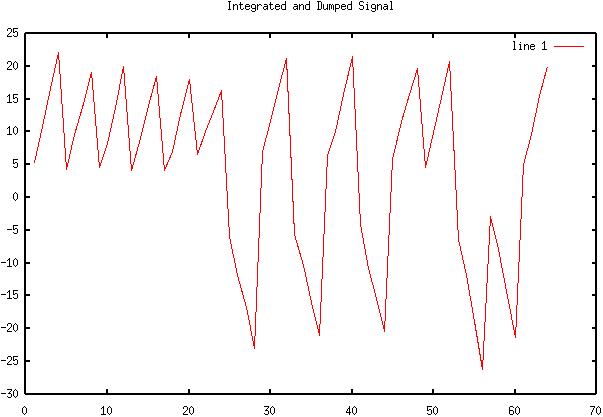
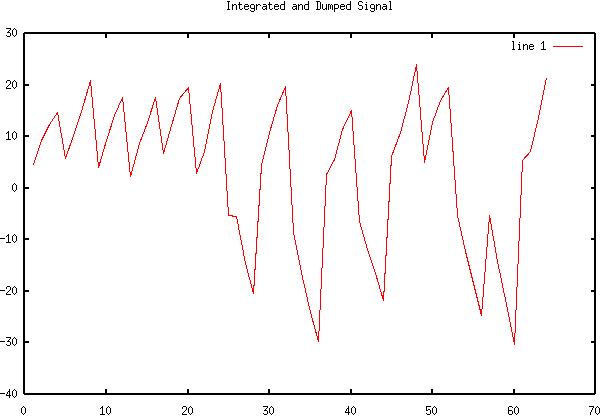
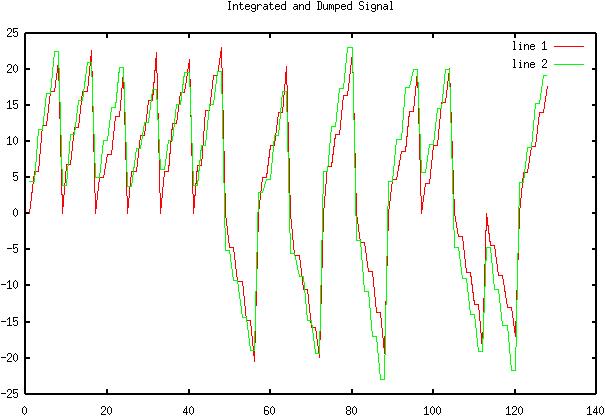
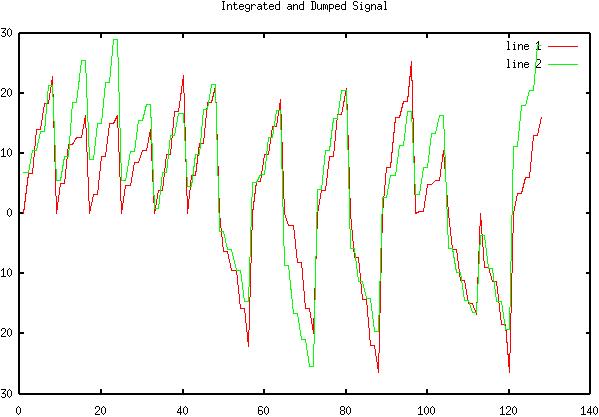
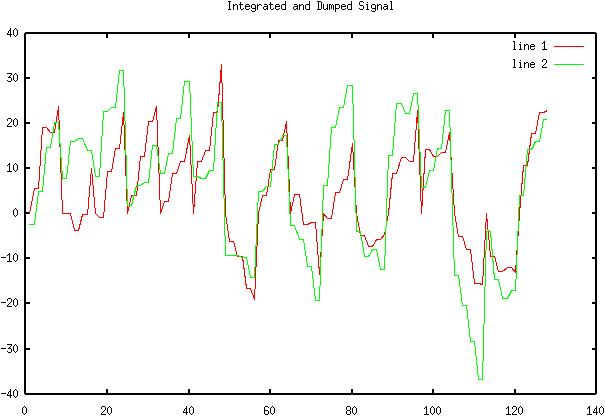
32: Integrated and dumped signal
34) Diagram
33: Original TTL signal for M=4 sd = 2 OOK transmission

35) Diagram
34: OOK Signal
36) Diagram
35: OOK Signal and noise
37) Diagram
36: OOK Signal after mixing
38) Diagram
37: Integrated and dumped signal
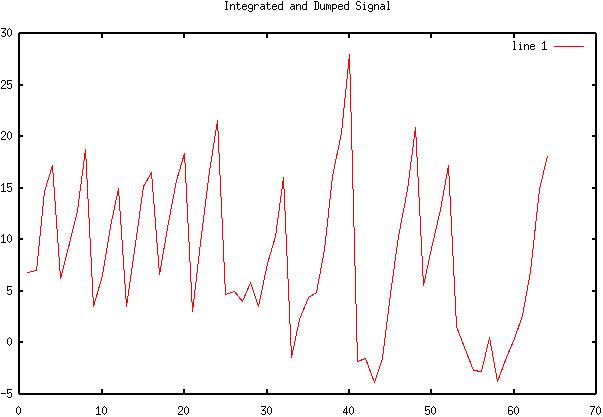
39) Diagram
38: Original TTL signal for M=4 sd = 4 OOK transmission
40) Diagram
39: OOK Signal

41) Diagram
40: OOK Signal and noise
42) Diagram
41: OOK Signal after mixing
43) Diagram
42: Integrated and dumped signal
44) Diagram
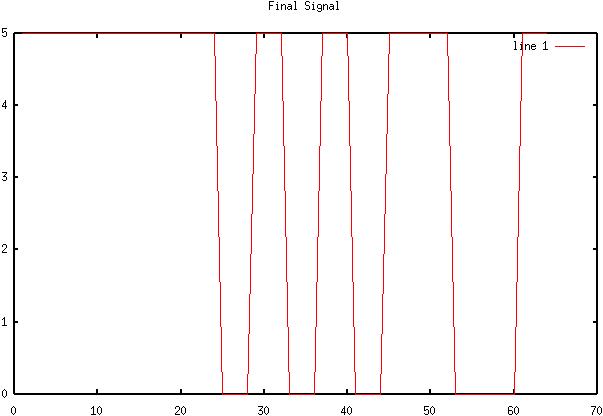
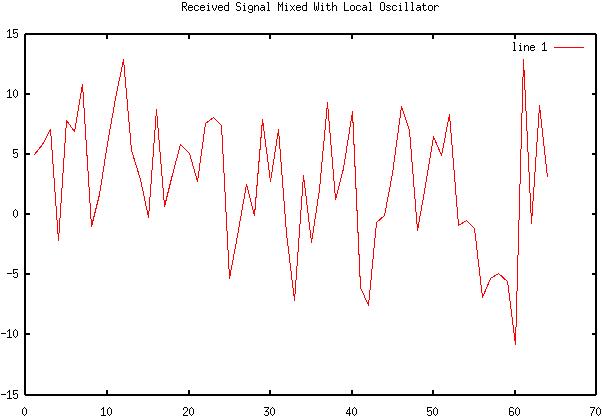
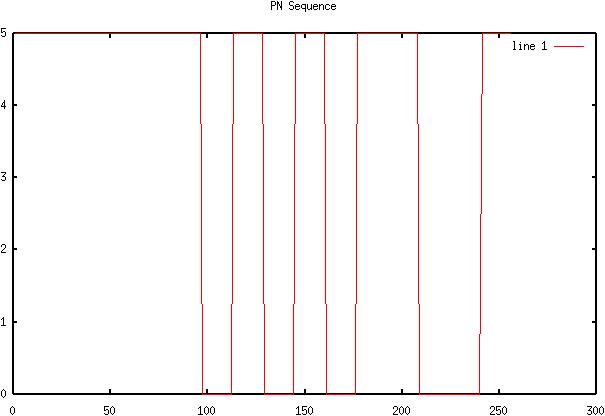
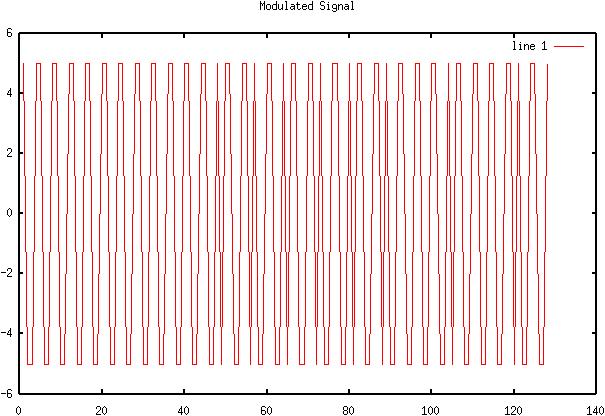
43: Original TTL signal for M=4 sd = 1 BPSK transmission
45) Diagram
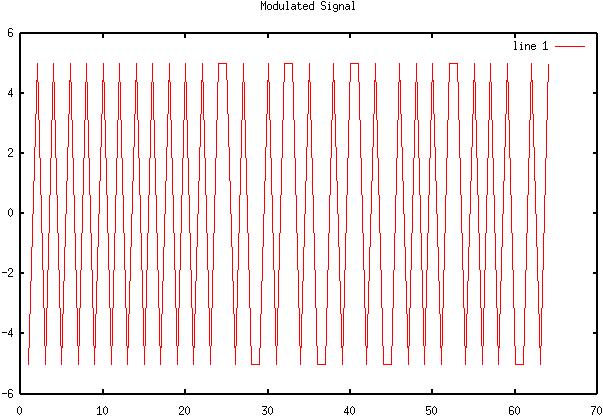
44: BPSK Signal
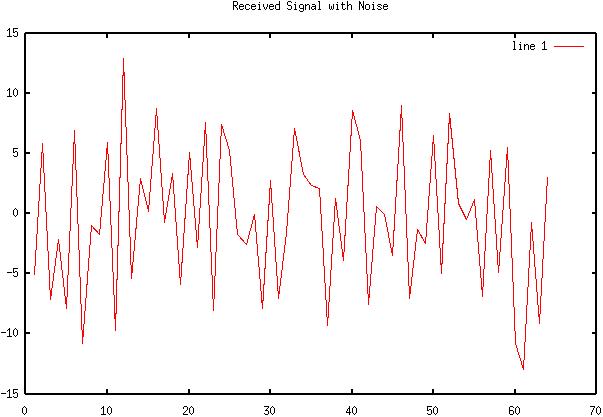
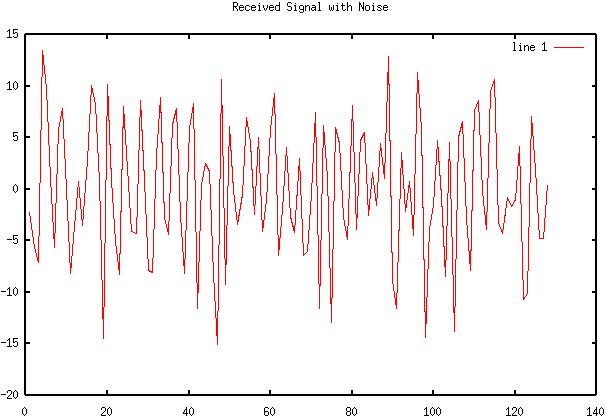
46) Diagram
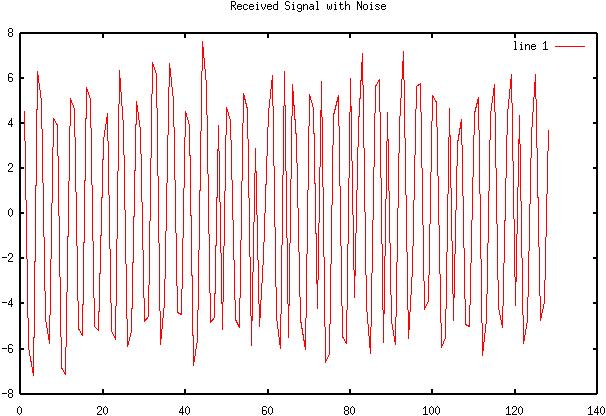
45: BPSK Signal and noise
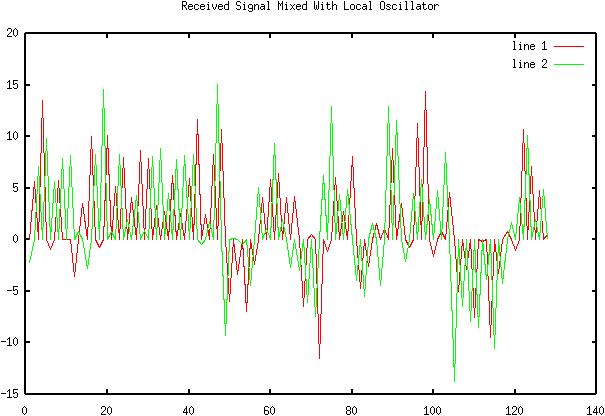
47) Diagram
46: BPSK Signal after mixing
48) Diagram
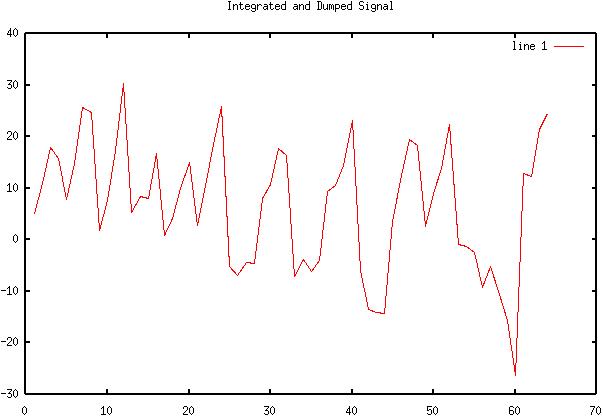
47: Integrated and dumped signal
49) Diagram
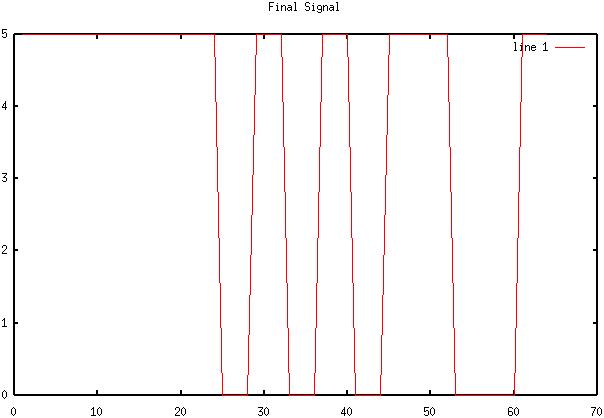
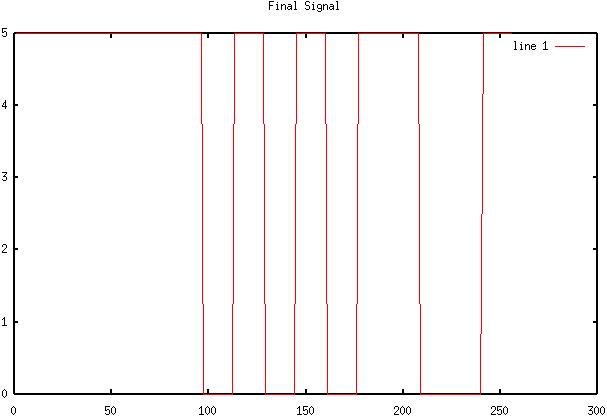
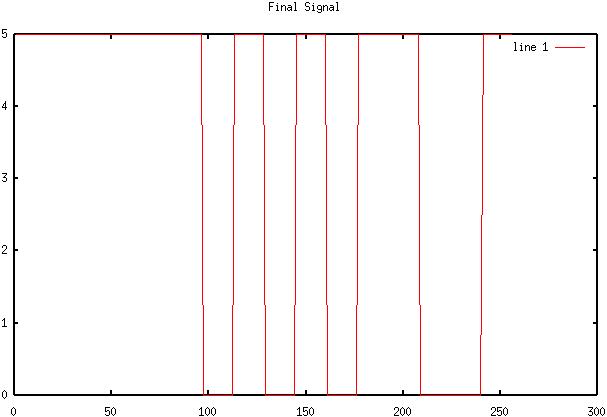
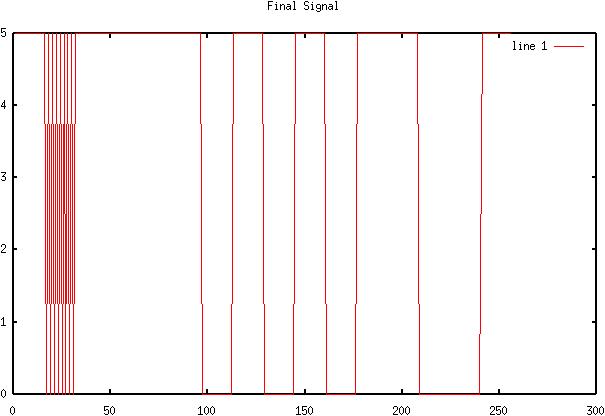
48: Final received signal
50) Diagram
49: Original TTL signal for M=4 sd = 2 BPSK transmission

51) Diagram
50: BPSK Signal
52) Diagram
51: BPSK Signal and noise
53) Diagram
52: BPSK Signal after mixing
54) Diagram
53: Integrated and dumped signal
55) Diagram
54: Final received signal
56) Diagram
55: Original TTL signal for M=4 sd = 4 BPSK transmission
57) Diagram
56: BPSK Signal
58) Diagram
57: BPSK Signal and noise
59) Diagram
58: BPSK Signal after mixing
60) Diagram
59: Integrated and dumped signal
61) Diagram
60: Final received signal

62) Diagram
61: Original TTL signal for M=8 sd = 1 QPSK transmission
63) Diagram
62: QPSK Signal

64) Diagram
63: QPSK Signal and noise
65) Diagram
64: QPSK Signal after mixing
66) Diagram
65: Integrated and dumped signal
67) Diagram
66: Final received signal
68) Diagram
67: Original TTL signal for M=8 sd = 2 QPSK transmission

69) Diagram
68: QPSK Signal
70) Diagram
69: QPSK Signal and noise
71) Diagram
70: QPSK Signal after mixing
72) Diagram
71: Integrated and dumped signal
73) Diagram
72: Final received signal
74) Diagram
73: Original TTL signal for M=8 sd = 4 QPSK transmission
75) Diagram
74: QPSK Signal
76) Diagram
75: QPSK Signal and noise
77) Diagram
76: QPSK Signal after mixing
78) Diagram
77: Integrated and dumped signal
79) Diagram
78: Final received signal
![]() Conclusions
Conclusions
This lab has demonstrated how various forms of digital signaling are affected by noise in the system. The results are fairly accurate, even though some of the percent errors are high. For QPSK modulation it was decided that the scaling factor (M value) should be set to 8. For some reason, when sampling a sine wave, as opposed to a cosine wave, the signal was indistinguishable. As a result, half of the bits were dropped before demodulation. To make sure the probability of a bit error was correct, several other tests were made using "Tesla coil" noise levels (sd > 1000). The result was usually .5 or something close to that value, which is expected.
![]() Attachments
Attachments