![]() Objective
Objective
The objective of this lab is to gain a better understanding of FM bandwidth by generating an FM wave and comparing it's spectrum to an expected one. Additionally, to compare the significant signal bandwidth to the predicted bandwidth calculated by Carson's Rule.
![]() Components Used
Components Used
1) FM Function Generator #1512
2) Voltage Regulated Power Supply #1517
3) Spectrum Analyzer #1939
4) Modulation Function Generator #1310
5) Oscilloscope #10875
6) Digital Multi-Meter #1367
7) Various components from the EE-301 / EE - 401 lab kit
![]() Procedures
Procedures
1) Set the FM function generator to a frequency of 1MHz.
2) Connect the output to the oscilloscope and the spectrum analyzer.
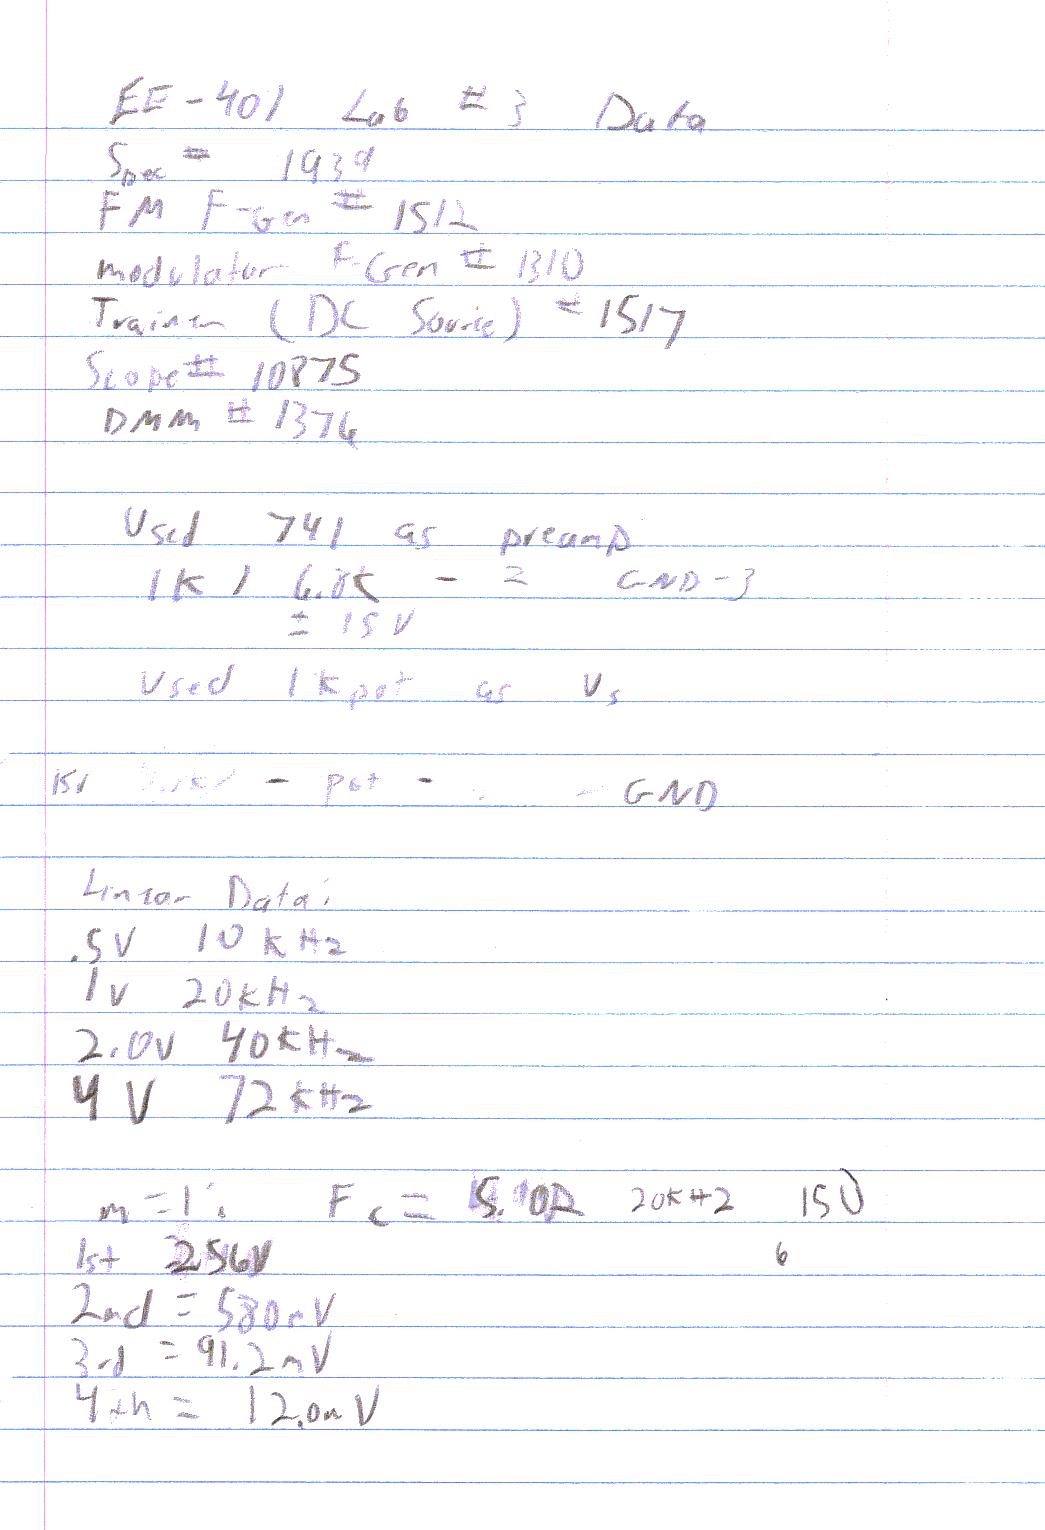
3) Apply a DC voltage of 1V to the input of the modulator.
4) Adjust the modulation gain of the modulator until the frequency deviation is 20KHz.
5) Apply a voltages of .5V, 1V, 2V, and 4V to the modulator and record the deviation.
6) Graph the results.
7) Disconnect the DC power source and connect the modulator to the input of the FM generator.
8) Adjust the modulator to have an 1Vp output and fm of 20KHz.
9) Record the output.
10) By adjusting the frequency of the modulator, generate a modulation index of .25.
11) Record the output.
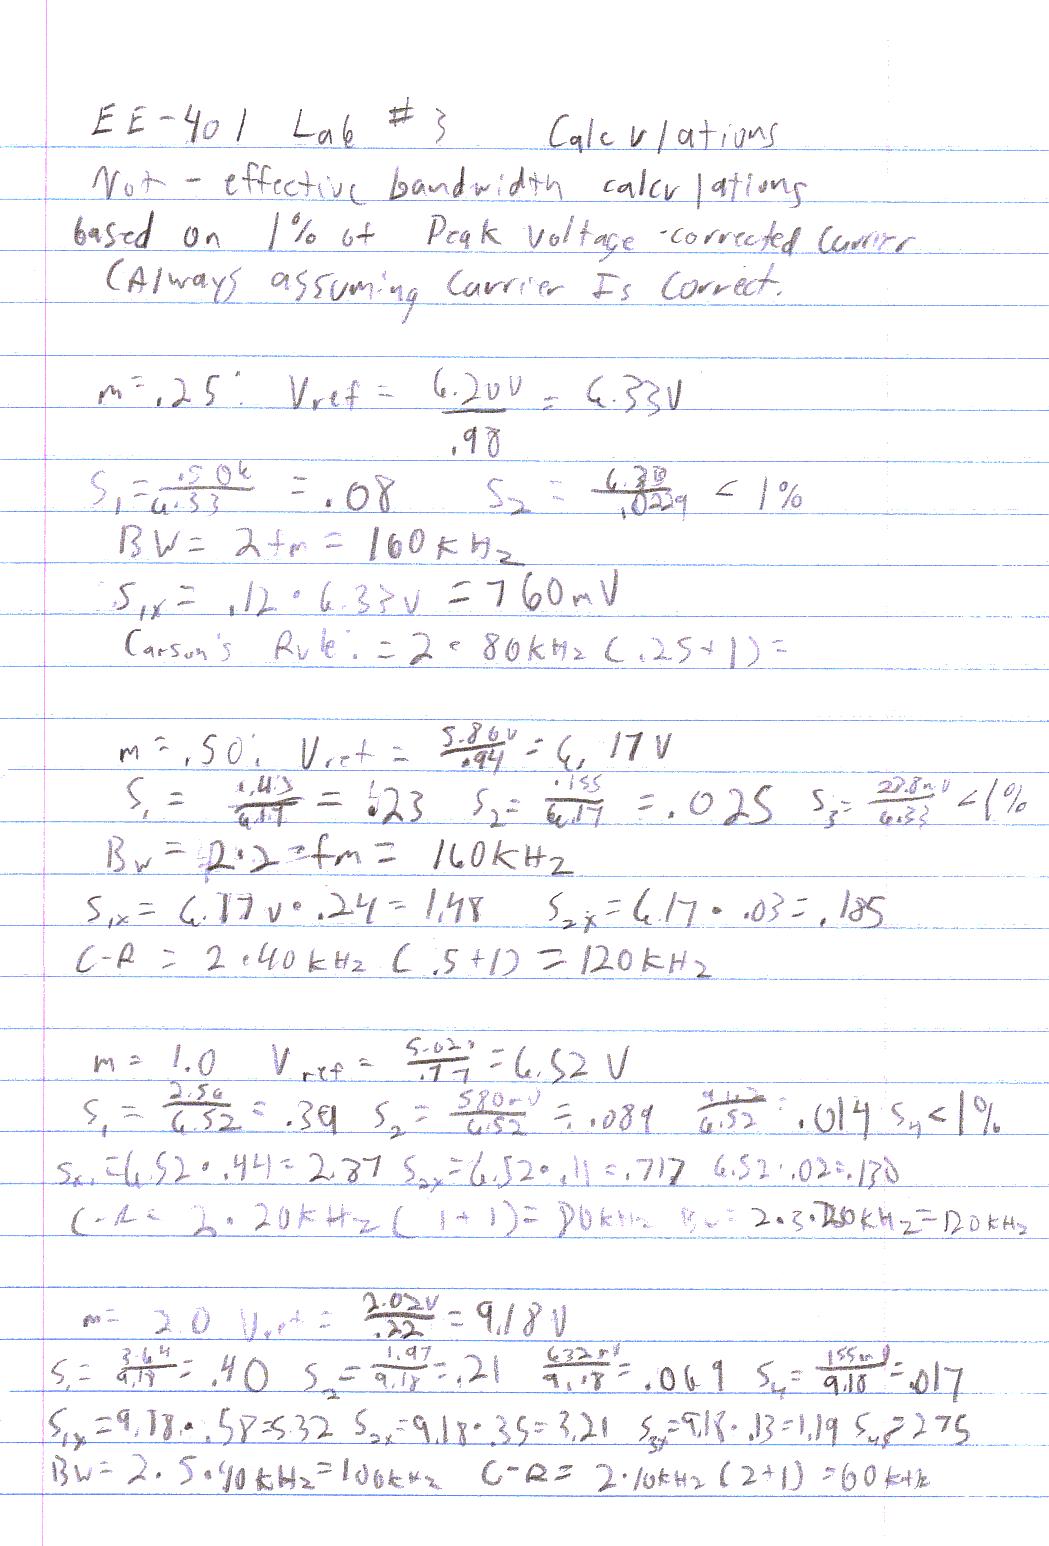
12) Calculate the expected spectrum.
13) Measure the spectrum on the spectrum analyzer and compare the results.
14) Compute the bandwidth using Carson's Rule and compare with the observed bandwidth.
15) Repeat steps 10 through 14 using modulation indices of .5, 1, 2, and 4.
![]() Lab
Data / Results
Lab
Data / Results
1) Diagram 1: Graph of Voltage vs. Deviation for FM Modulator:
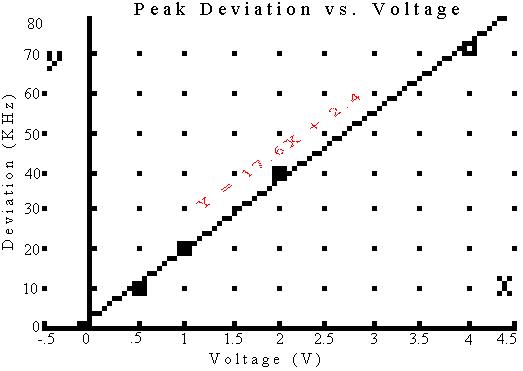
2) Table 1: Voltage vs. Deviation Data:
|
|
.5V |
1.0V |
2.0V |
4.0V |
|---|---|---|---|---|
|
Deviation: |
10KHz |
20KHz |
40KHz |
72KHz |
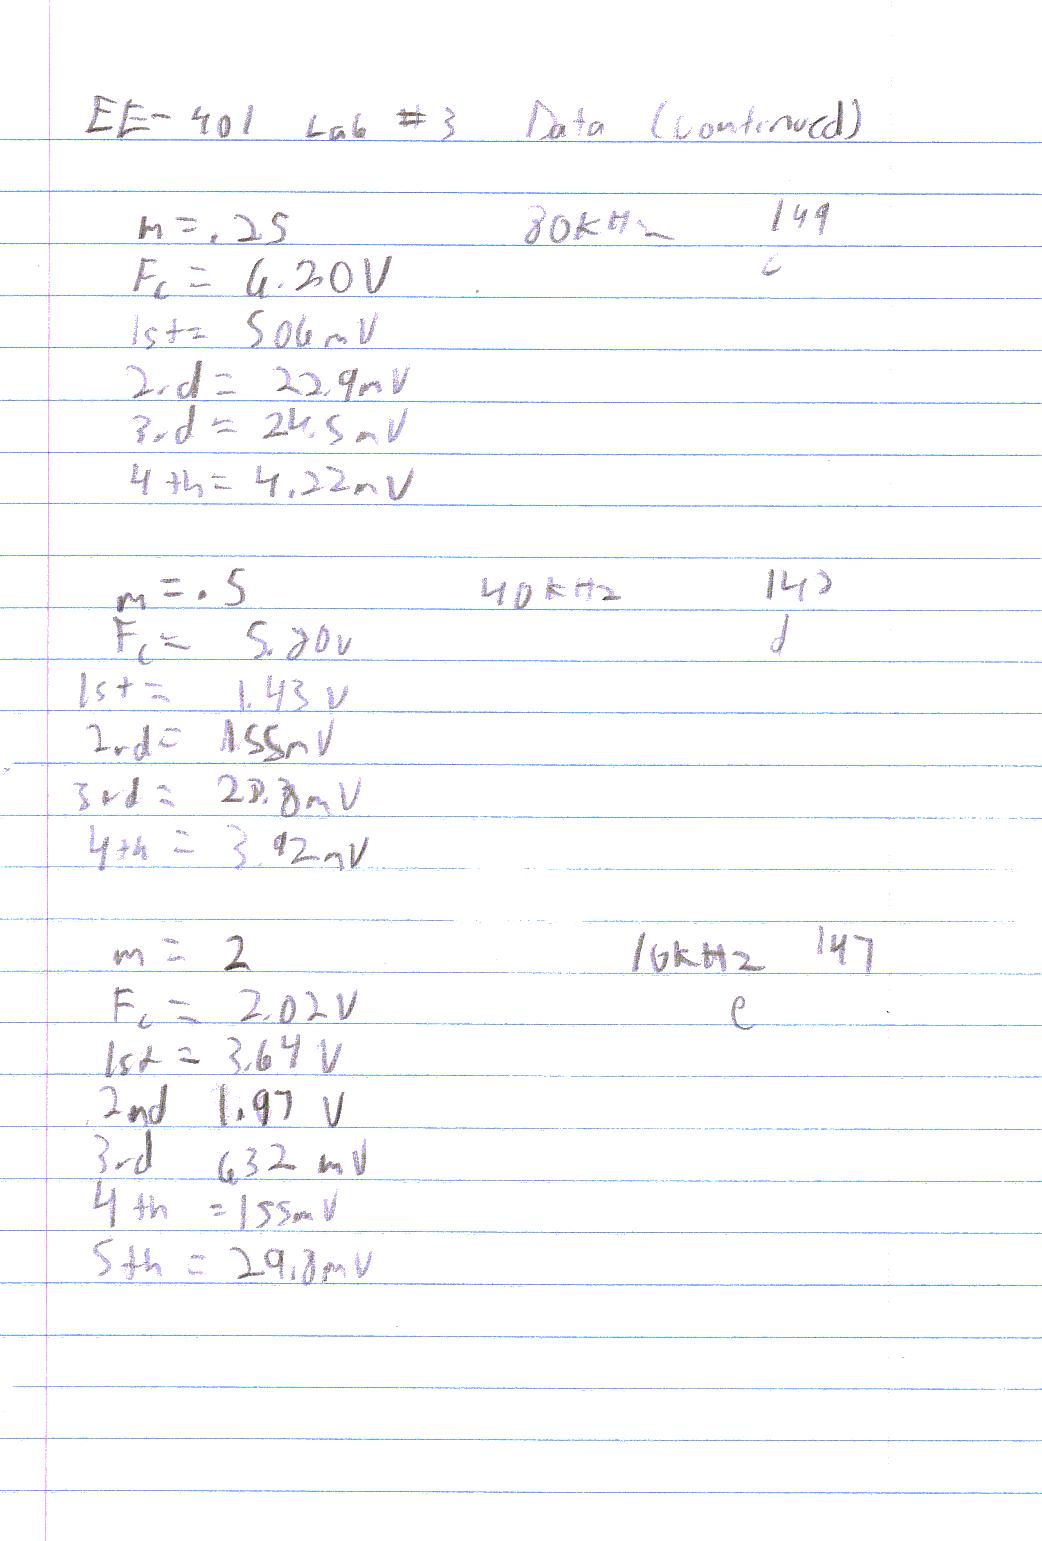
3) Table 2: Expected vs. Observed Data at mf of .25:
|
|
Carrier: |
1st |
2nd |
3rd |
4th |
Bandwidth |
|---|---|---|---|---|---|---|
|
Expected: |
6.20V |
760mV |
0 |
0 |
0 |
200KHz |
|
Observed: |
6.20V |
506mV |
22.9mV |
24.5mV |
4.22mV |
160KHz |
|
Difference: |
0 |
254mV |
22.9mV |
24.5mV |
4.22mV |
40KHz |
4) Diagram 2: Frequency Modulation with mf of .25:
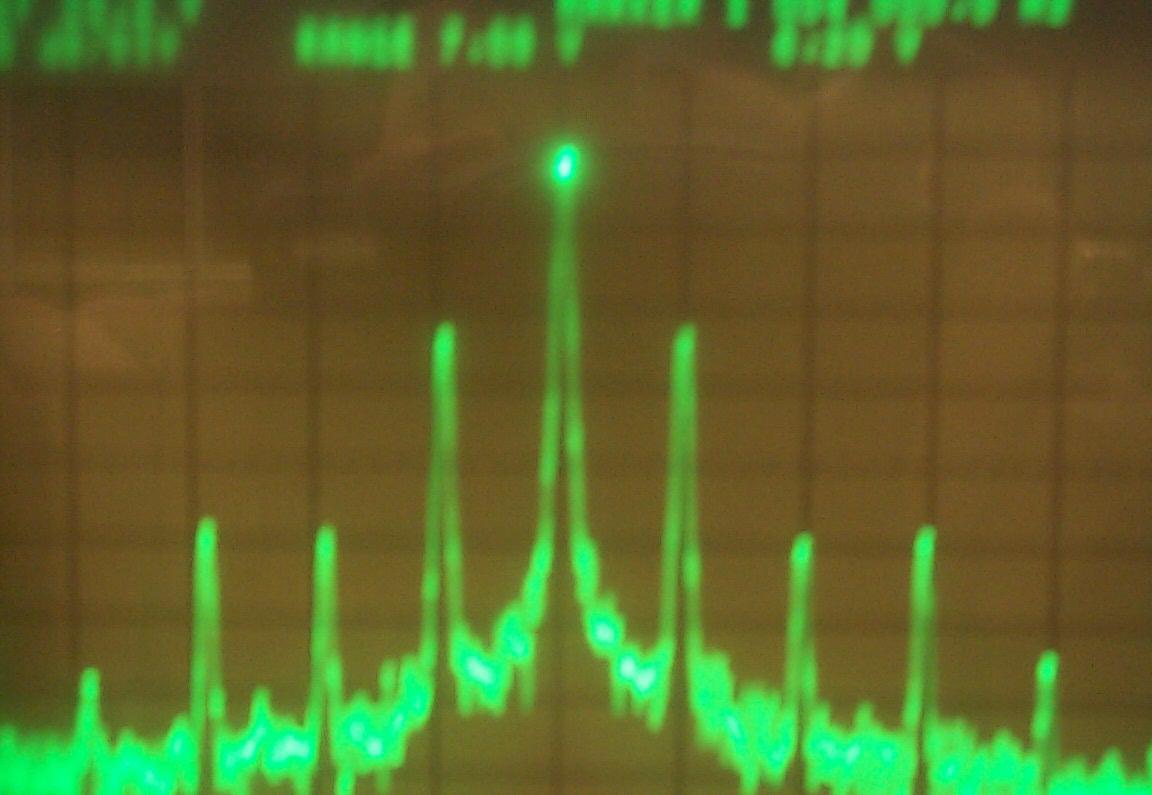
5) Diagram 3: Frequency Modulation with mf of .50:
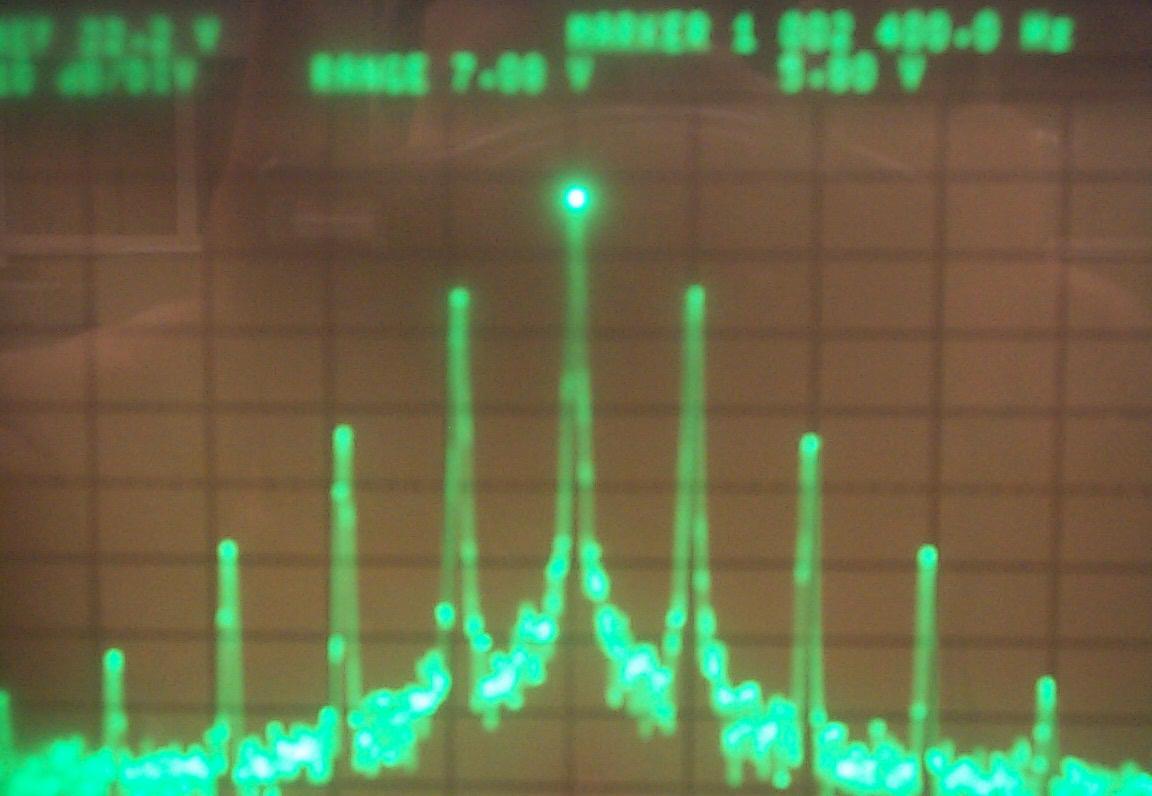
6) Table
3: Expected vs. Observed Data at mf of .50:
|
|
Carrier: |
1st |
2nd |
3rd |
4th |
Bandwidth |
|---|---|---|---|---|---|---|
|
Expected: |
5.80V |
1.48V |
185mV |
0 |
0 |
120KHz |
|
Observed: |
5.80V |
1.43V |
155mV |
28.8mV |
4.22mV |
160KHz |
|
Difference: |
0 |
50mV |
30mV |
28.8mV |
4.22mV |
40KHz |
7) Diagram 4: Frequency Modulation with mf of 1.0:
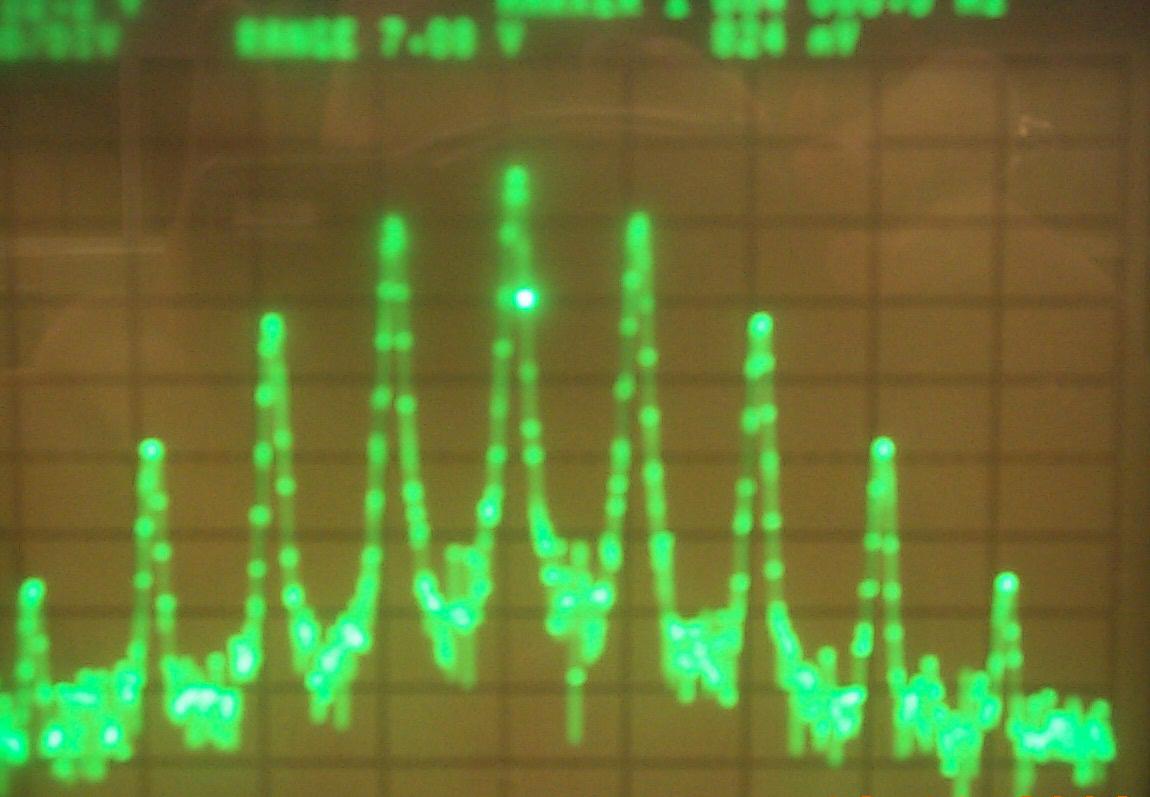
8) Table 4: Expected vs. Observed Data at mf of 1.0:
|
|
Carrier: |
1st |
2nd |
3rd |
4th |
Bandwidth |
|---|---|---|---|---|---|---|
|
Expected: |
5.02V |
2.87V |
717mV |
130mV |
0 |
80KHz |
|
Observed: |
5.02V |
2.56V |
580mV |
91.2m |
12.0mV |
120KHz |
|
Difference: |
0 |
310mV |
137mV |
38.8mV |
12.0mV |
40KHz |
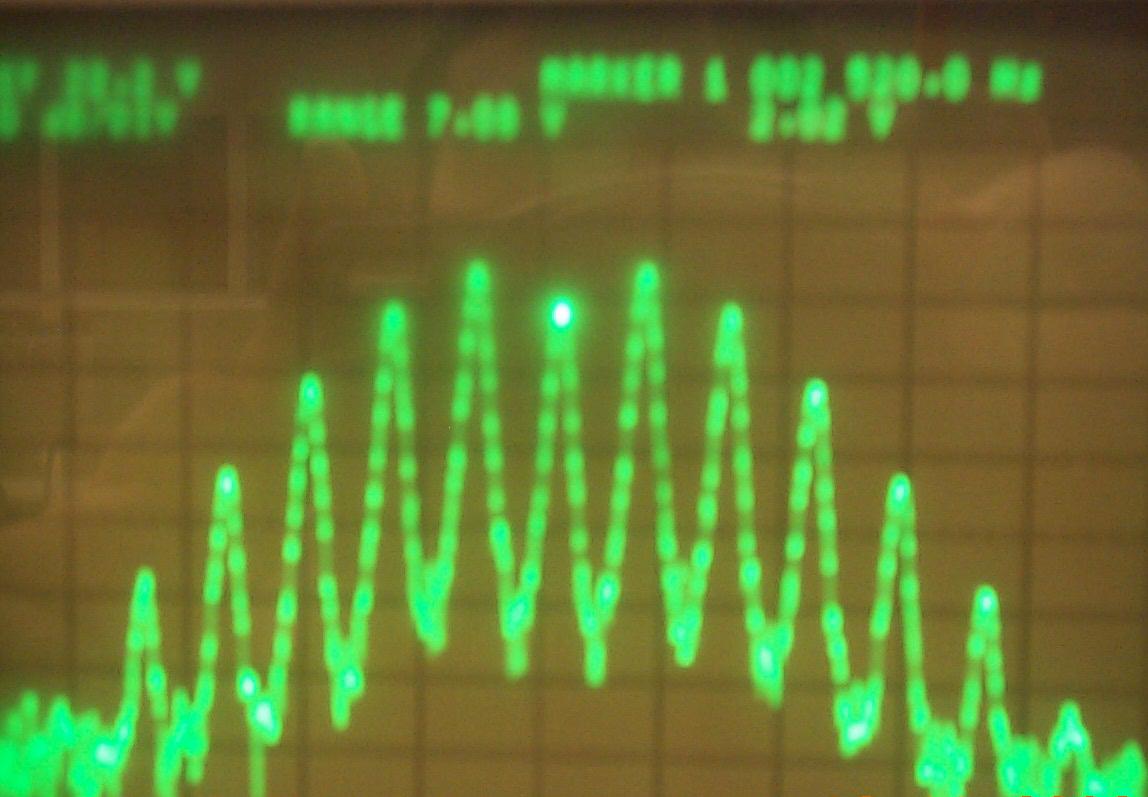
9) Table 5: Expected vs. Observed Data at mf of 2.0:
|
|
Carrier: |
1st |
2nd |
3rd |
4th |
5th |
Bandwidth |
|---|---|---|---|---|---|---|---|
|
Expected: |
2.02V |
5.32V |
3.21v |
1.19V |
275mV |
0 |
60KHz |
|
Observed: |
2.02V |
3.64V |
1.97V |
632mV |
155mv |
29.8mV |
100KHz |
|
Difference: |
0 |
2.68V |
1.24V |
558mV |
120mV |
29.8mV |
40KHz |
10) Diagram 5: Frequency Modulation with mf of 2.0:
11) Table 6: Modulation Index vs. Frequency:
|
Modulation Index: |
0.25 |
0.50 |
1.0 |
2.0 |
4.0 |
|---|---|---|---|---|---|
|
Frequency: |
80KHz |
40KHz |
20KHz |
10KHz |
5KHz |
|
Deviation: |
20KHz |
20KHz |
20KHz |
20KHz |
20KHz |
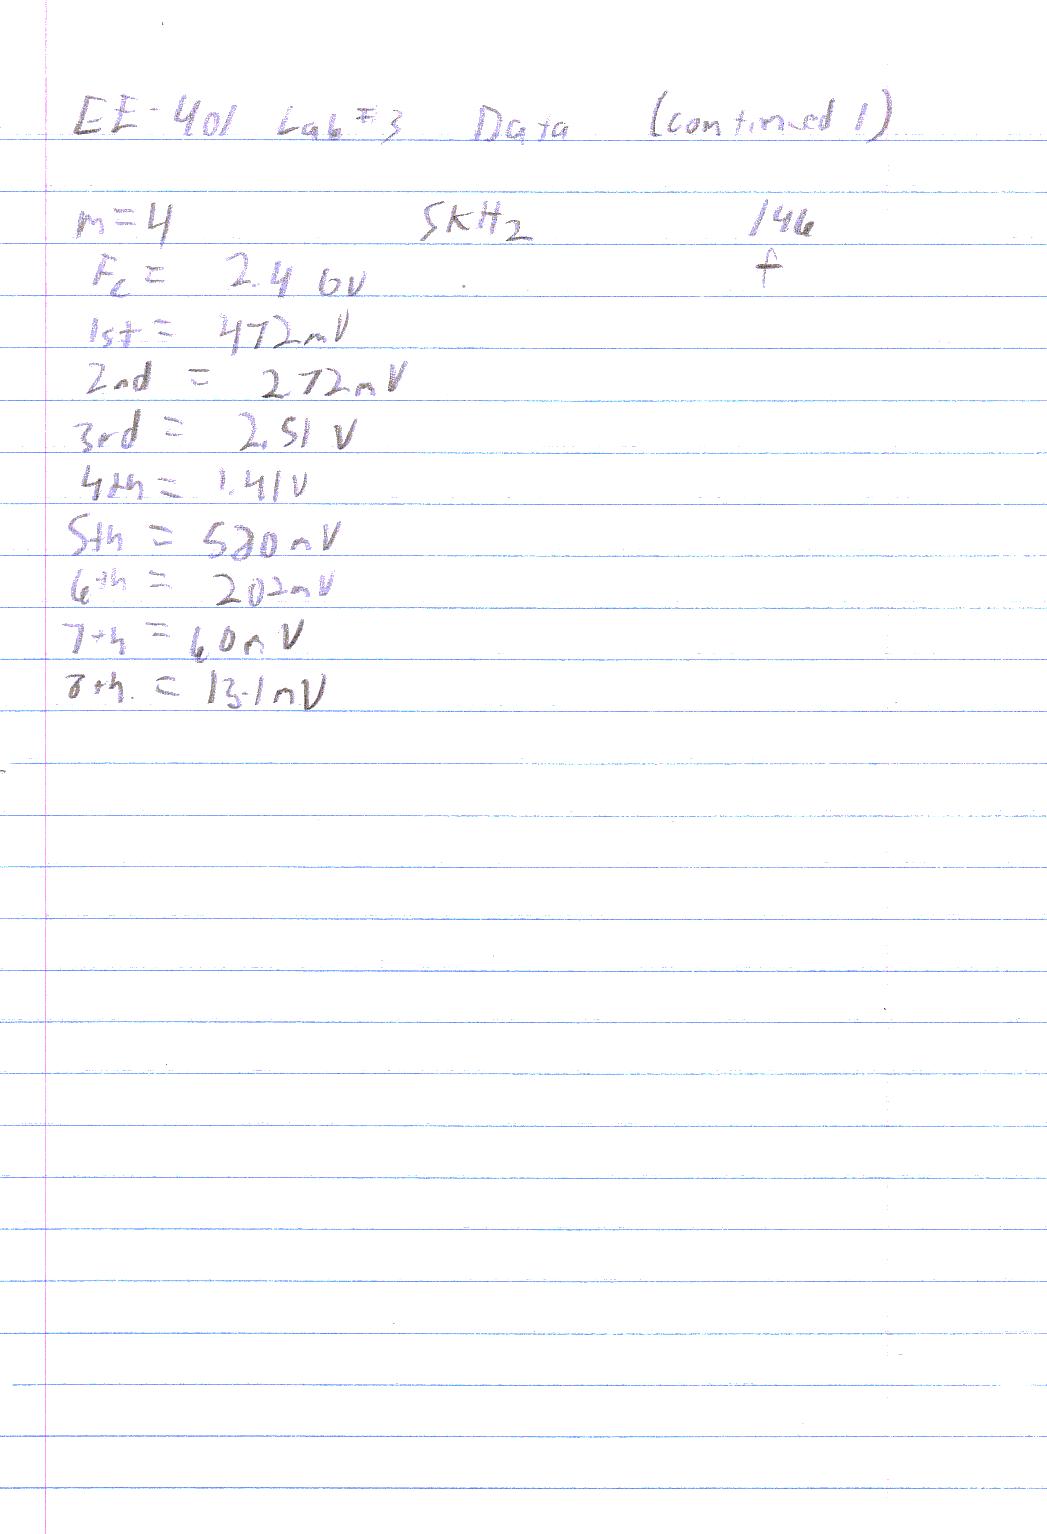
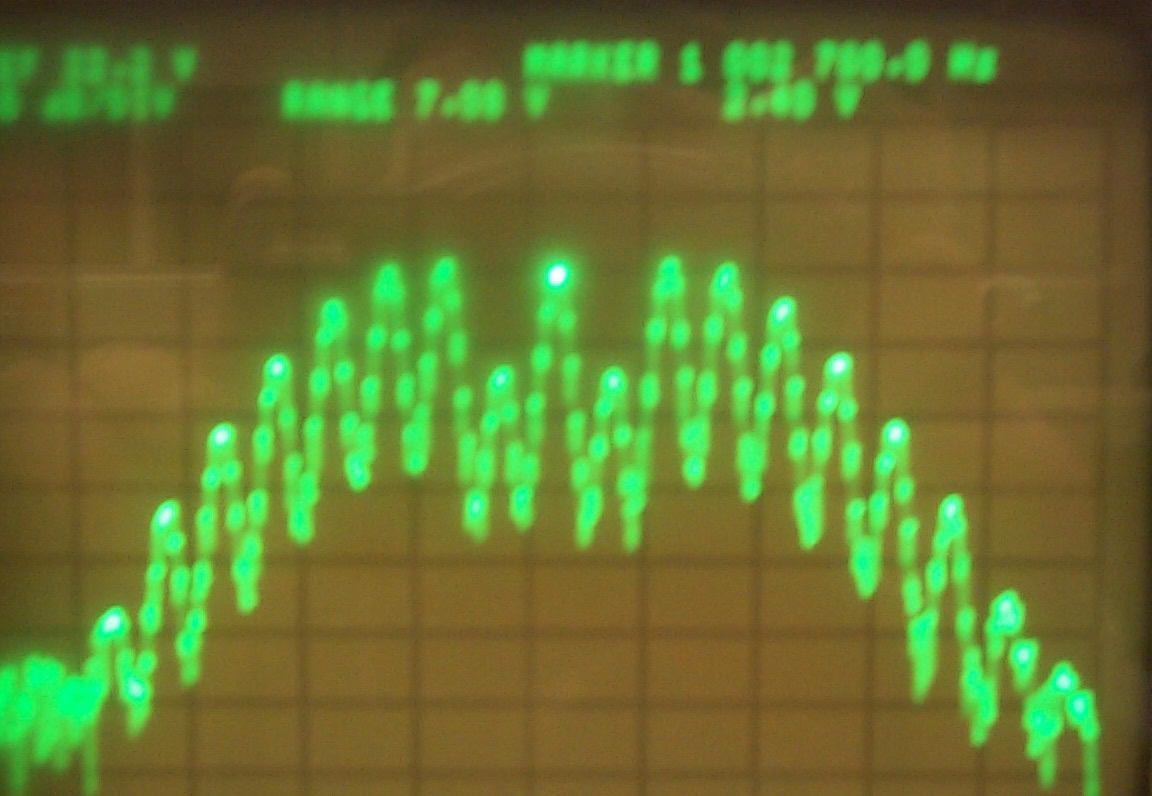
12) Table 7: Expected vs. Observed Data at mf of 2.0:
|
|
Expected: |
Observed: |
Jx |
Ox |
Difference: |
|---|---|---|---|---|---|
|
Carrier: |
2.40V |
2.40V |
.40 |
.40 |
0 |
|
1st Side Band: |
420mV |
472mV |
.07 |
.079 |
52mV |
|
2nd Side Band: |
2.16V |
2.72V |
.36 |
.45 |
560mV |
|
3rd Side Band: |
2.58V |
2.51V |
.43 |
.42 |
70mV |
|
4th Side Band: |
1.68V |
1.41V |
.28 |
.24 |
270mV |
|
5th Side Band: |
780mV |
580mV |
.13 |
.10 |
200mV |
|
6th Side Band: |
300mV |
202mV |
.05 |
.033 |
98mV |
|
7th Side Band: |
120mV |
60.0mV |
.02 |
.01 |
60mV |
|
8th Side Band: |
0 |
13.1mV |
0 |
0 |
13.1mV |
|
Bandwidth: |
70KHz |
50KHz |
0 |
0 |
20KHz |
13) Diagram 6: Frequency Modulation with mf of 2.0:
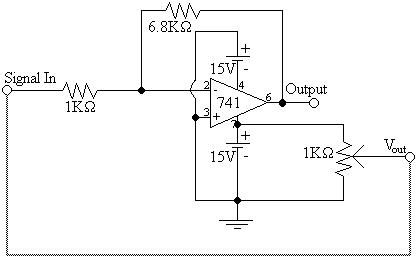
14) Diagram 7: Schematic of Helper Circuitry:
![]() Answers to Lab Questions
Answers to Lab Questions
1) Q: What modulation index yielded a bandwidth closest to that of AM, and why?
A: mf = .25 because the signal has only one set of side bands that are very low.
2) Q: If there was an FM signal that had an fc of 10MHz and deviated between 10.004MHz and 9.996MHz at a rate of 100Hz, what would the fm and mf be?
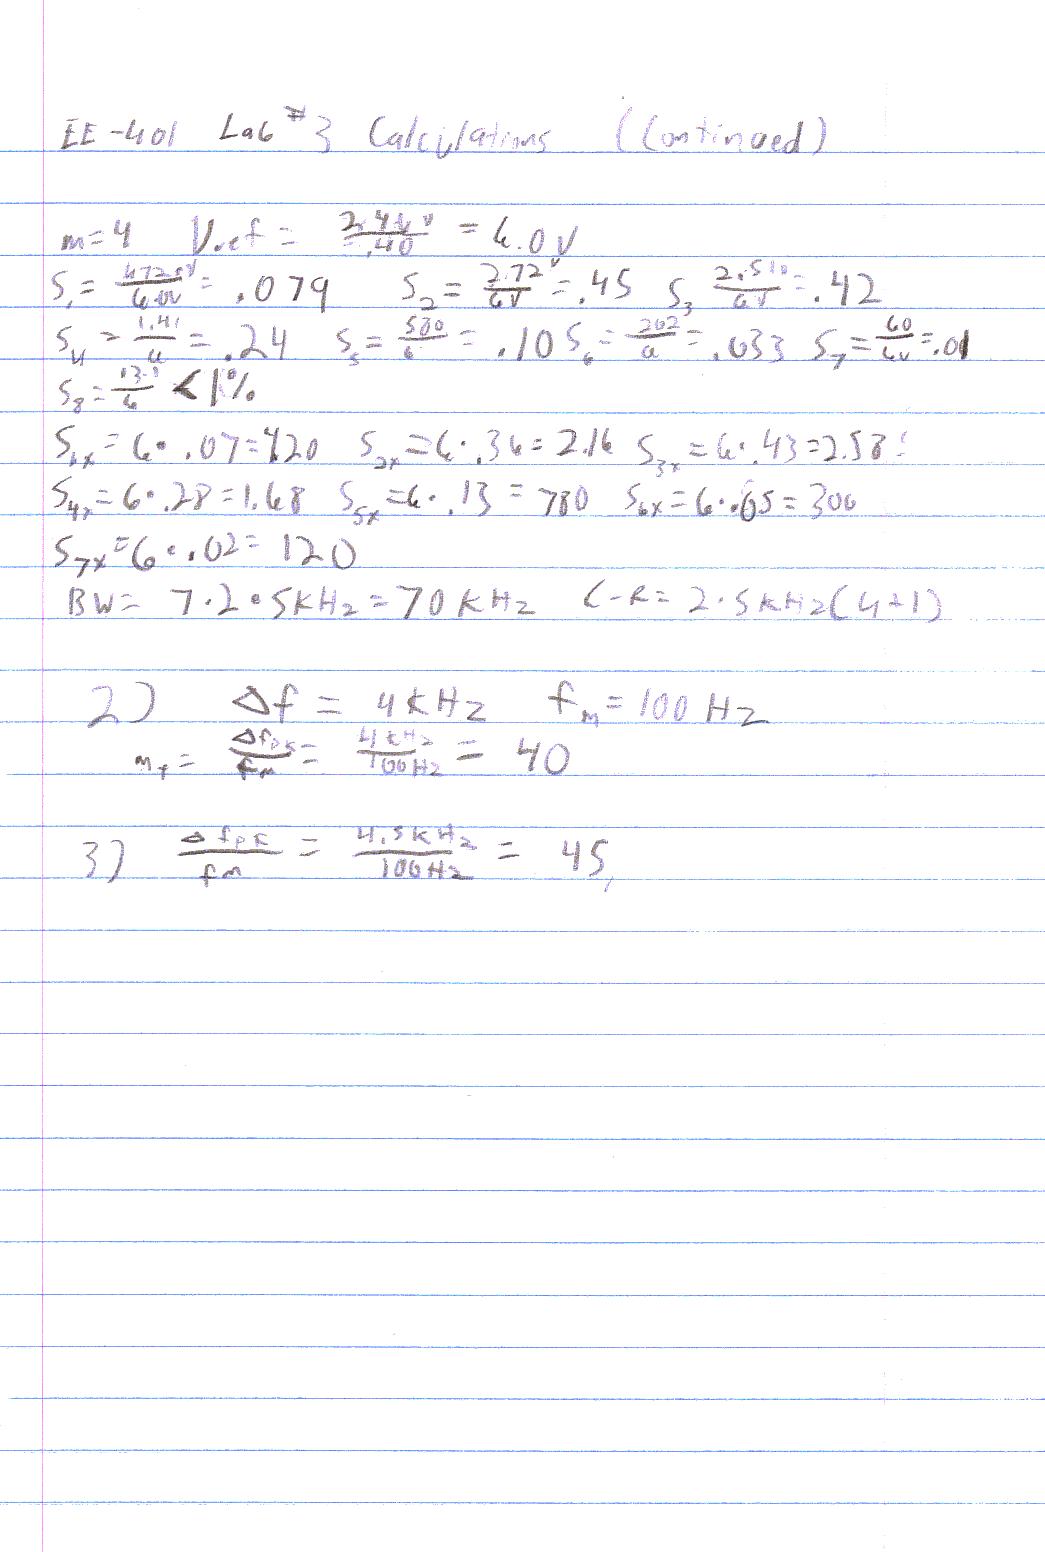
A: mf = 40, fm = 100Hz
3) Q: Given the same information in question 2, except the signal deviates form 10.005MHz to 9.996MHz, what is the modulation index, modulation freqency, and what type of wave would cause this?
A: mf = 45, fm = 100Hz; The signal is sinusoidal with a slight DC offset.
![]() Conclusions
Conclusions
This lab has demonstrated that the bandwidth of an FM signal can be predicted in multiple ways. The ways are by predicting the size of the side bands or by using Carson's rule. Interestingly enough, the difference in bandwidths were identical throughout most of the trials. I believe that this is because Carson's Rule is based on 1% power and my method is based on 1% voltage. The FCC generally wants signal overtones attenuated between 40dB and 60dB from their useful counterparts, therefore, I believe that my method (BW = 2 * nsidebands * fmpk) is much more accurate. It should be noted that, in order to obtain a 20KHz deviation at a 2Vpp signal, a pre amplifier was required. The 1Vp signal was applied to the input of the operational amplifier preamplifier input signal. All fm calculations were based off of this input. Because of some of the operational amplifiers limitations, I believe that many of the inaccuracies in this lab can be attributed to that. However, the lab was fairly accurate. I do believe that the carrier calculation for mf = 2.0 was incorrect and let that set of results to be somewhat inaccurate. It is also possible that the signal generator was not accurate and therefore the signal was not truly 2.0. For the voltage offsets, the signal from the 1KW pot was sent to the input of the preamplifier. I believe that some of the inaccuracies of the last reading of 72KHz was possible skewed by this as well. I calculated and figured that with an amplification of approximately 5.8 and a Vi of 4V, compounded with the face that the power supply was not truly balanced, the op - amp was attempting to put out a voltage beyond it's capabilities and therefore caused skewed results. I am satisfied with the results of the lab due to the circumstances that it was run under. For a schematic diagram of the assist circuit, please refer to item #14, Diagram 7.
![]() Attachments
Attachments
