EE - 456 / E01 spring 2003
Advanced Communications Theory
Professor: Arida
Submitted By:
Andrew Buettner
Lab #1: Quantization
Table Of Contents
1) Cover Page 1
2) Table of Contents 2
3) Objective 3
4) Components Used 3
5) Procedures 3
6)
Lab Data / Results 3
1) Table 1 3
2) Diagram 1 4
3) Diagram 2 4
4) Diagram 3 5
5) Diagram 4 5
6) Diagram 5 6
7) Diagram 6 6
8) Diagram 7 7
7 Answers to Lab Questions 7
7) Conclusions 8
8) Attachments 8
Objective
The objective of this lab is to quantize sinewaves and compute the signal-to-noise ratio. The results will be compared to a predicted value that will be computed through a given formula.
Components Used
1) Computer with Octave installed
Procedures
1) Generate a 512 sample sinewave with f=1Hz and an amplitude of 1023
2) Plot the signal
3) Quantize the signal using the command "xq = 128*round(x./128);"
4) Plot both functions
5) Create function "d" that is the difference between "x" and "xq"
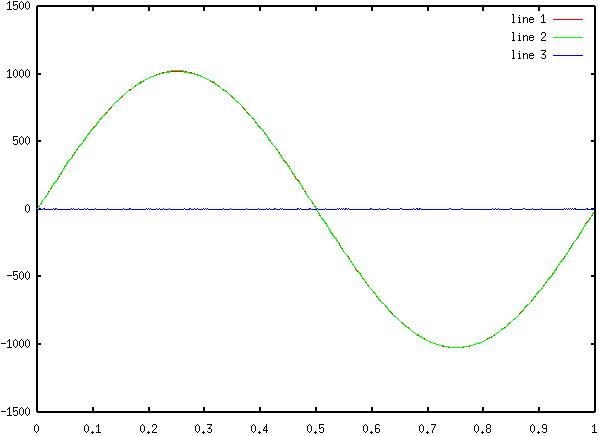
6) Plot all three functions.
7) Calculate the variance using "vx=(x*x')./511"
8) Calculate the variance of d using a similar method
9) Calculate the distortion ratio using SDR=vx/vd
10) Compare to an expected distortion ratio 6*(A/q)^2
11 Repeat steps 3 - 9 for quantization of 5, 6, 7, and 8 bits, only plot the culmination of all three functions.
Lab Data / Results
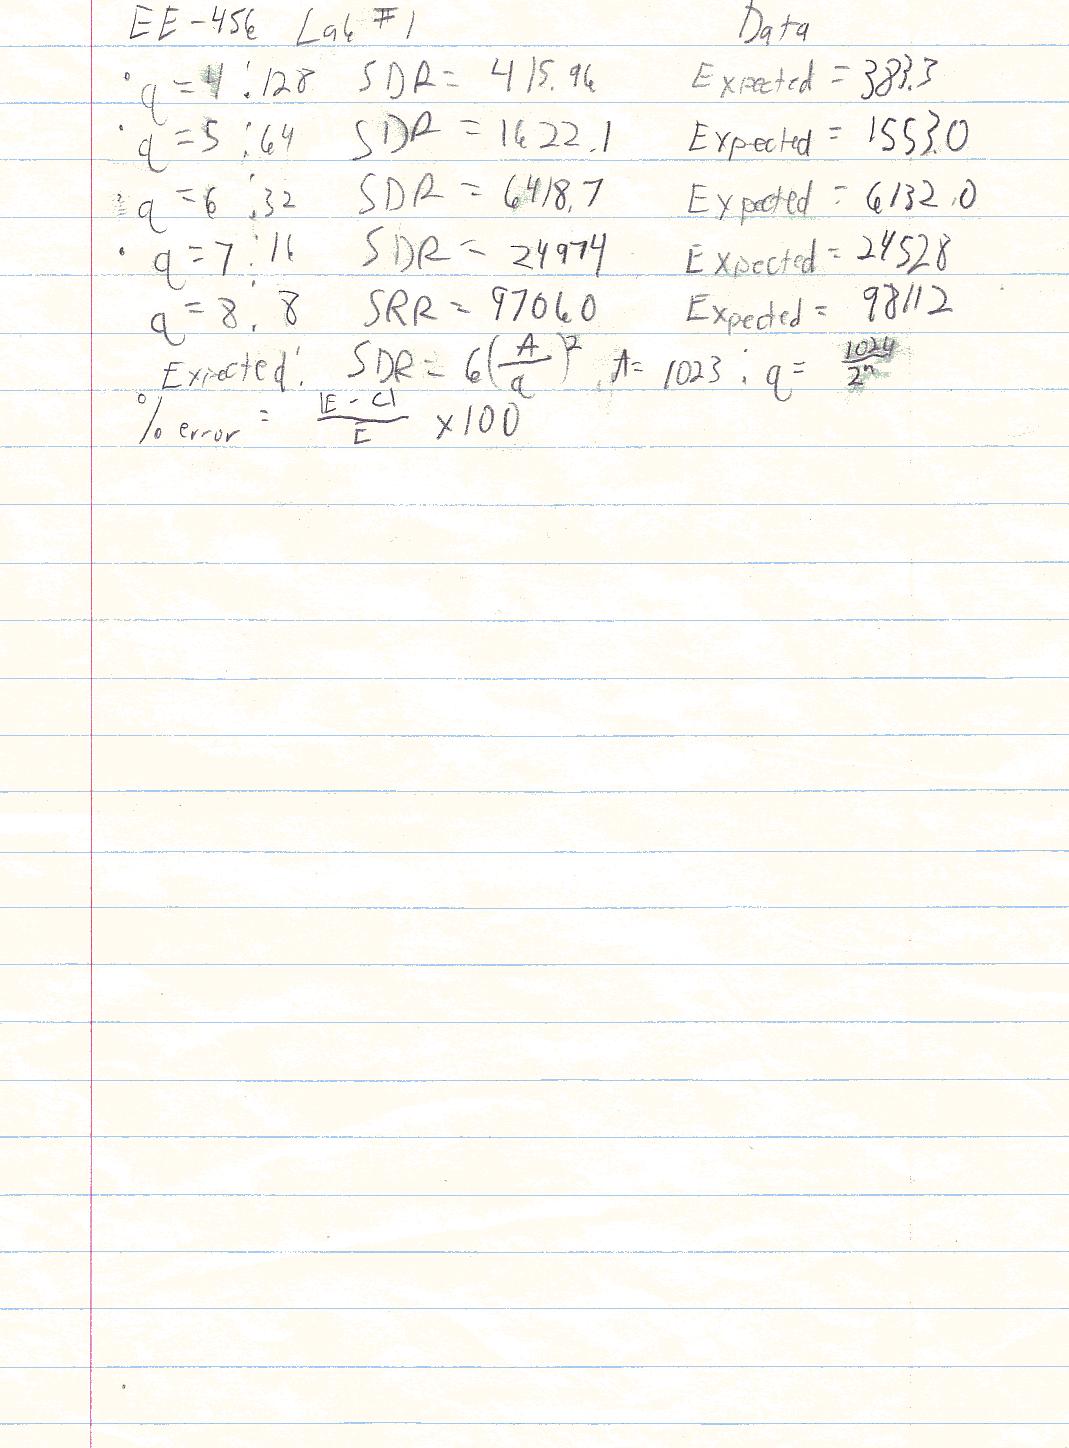
1) Table 1: Signal to Distortion Results
Number of Bits |
Quantization Interval |
Observed SDR |
Expected SDR |
% Error |
---|---|---|---|---|
Q = 4 |
128 |
415.96 |
383.3 |
8.52% |
Q = 5 |
64 |
1622.1 |
1553.0 |
4.45% |
Q = 6 |
32 |
6418.7 |
6132.0 |
4.68% |
Q = 7 |
16 |
24974 |
24528 |
1.82% |
Q = 8 |
8 |
97060 |
98112 |
1.07% |
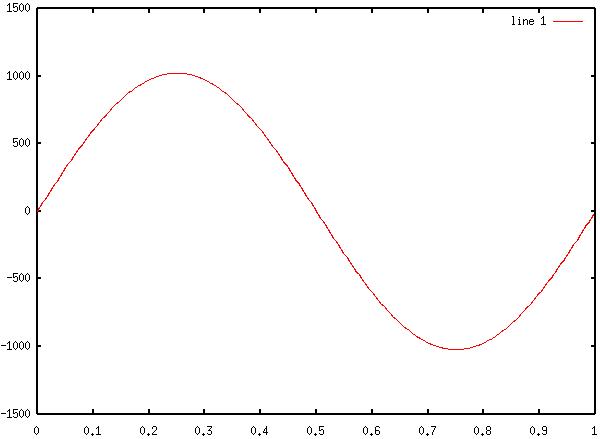
2) Diagram 1: Original Sinewave
3) Diagram
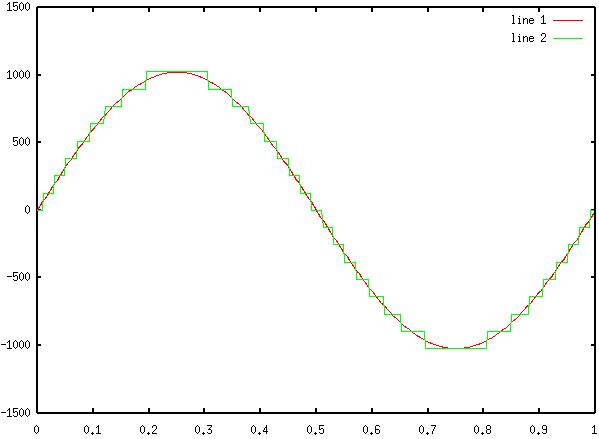
2: Original Sinewave and 4 bit Quantized Wave
4) Diagram
3: Original Sinewave, 4 bit Quantized, and Difference
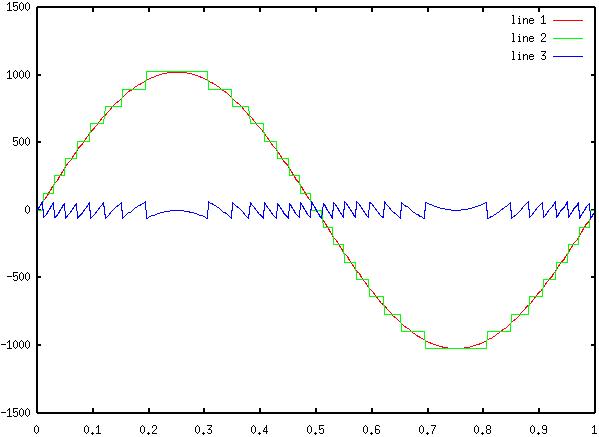
5) Diagram
4: Original Sinewave, 5 bit Quantized, and Difference
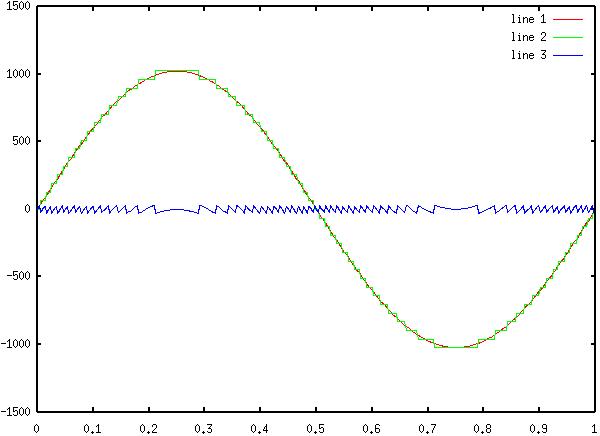
6) Diagram
5: Original Sinewave, 6 bit Quantized, and Difference
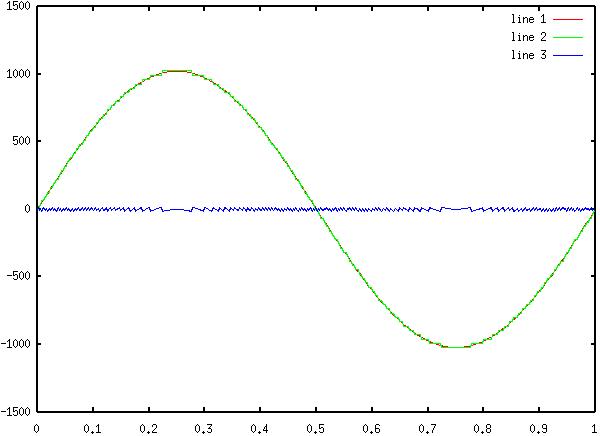
7) Diagram
6: Original Sinewave, 7 bit Quantized, and Difference
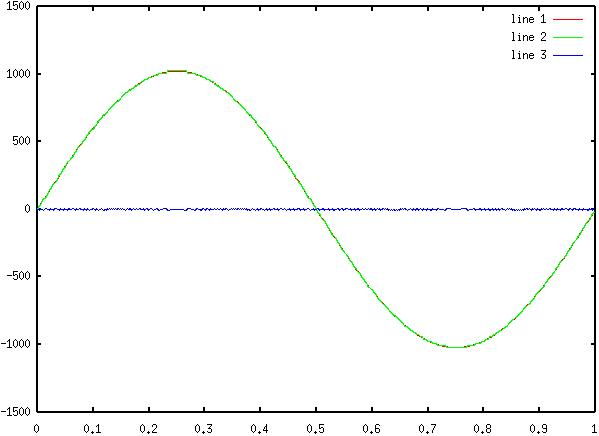
8) Diagram
7: Original Sinewave, 8 bit Quantized, and Difference
Answer to Lab Questions
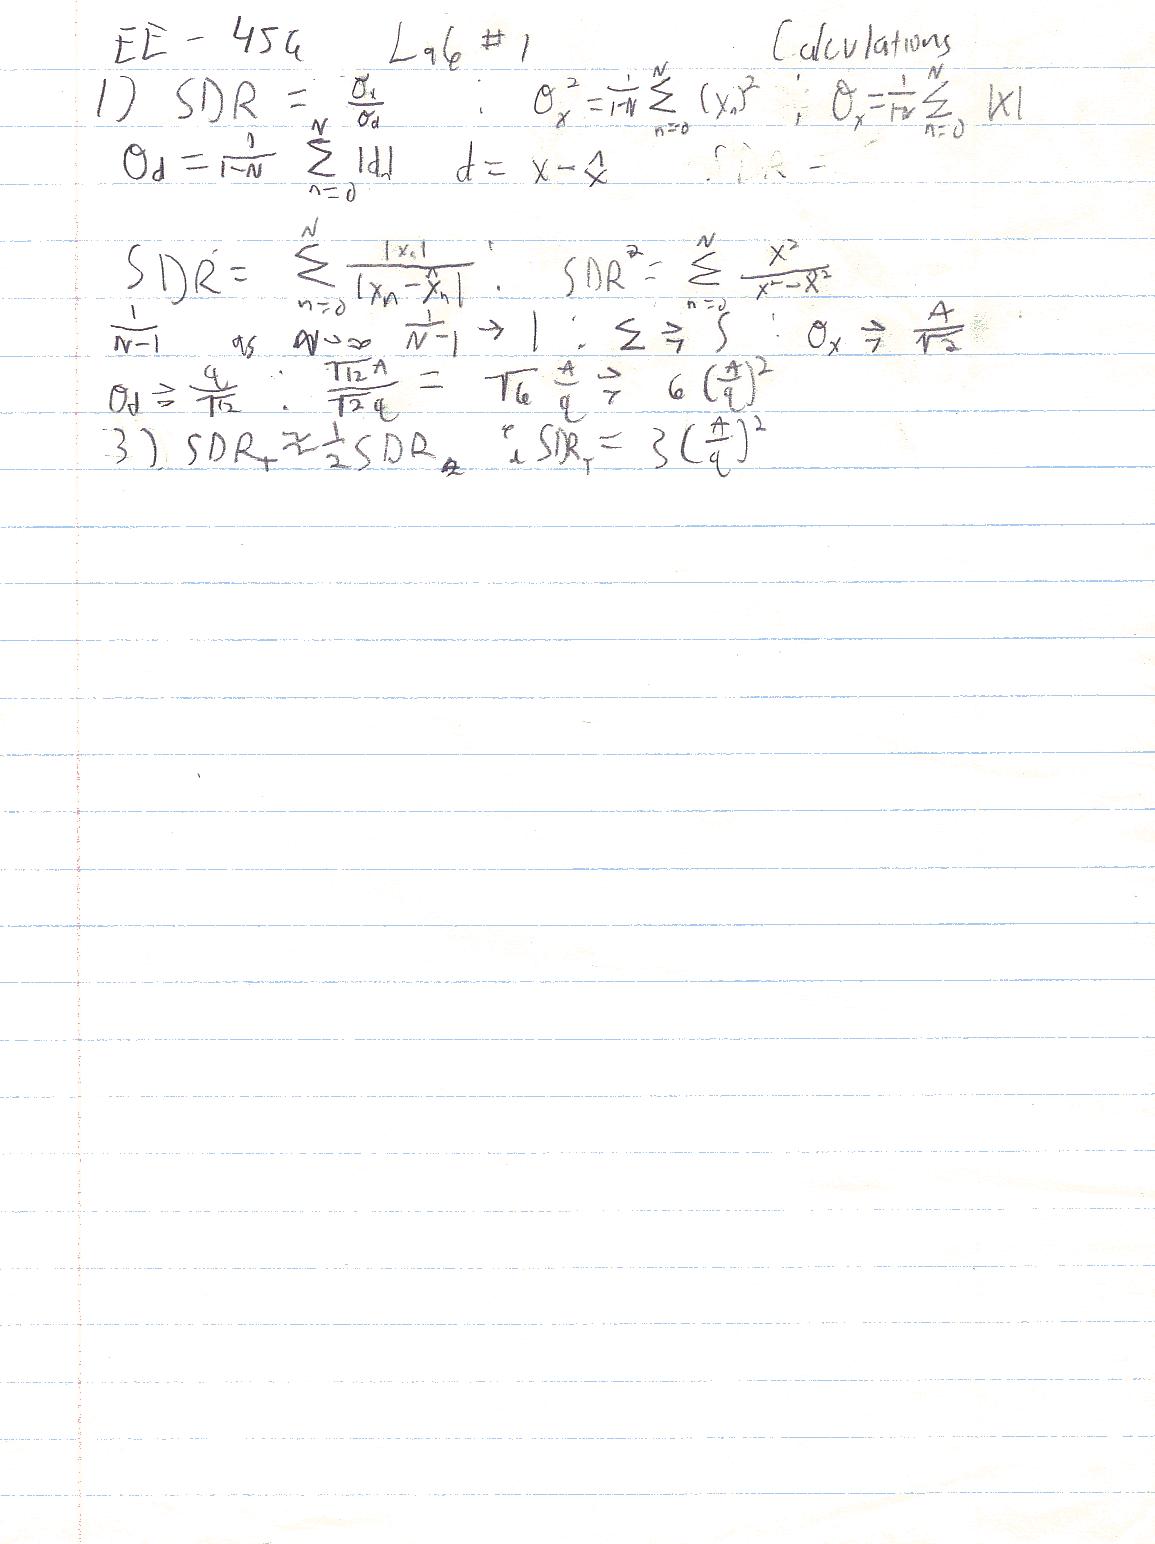
1) Q: Derive the formula SDR=6*(A/q)2
A: See Attachments::Calculations
2) Q: Given a quantized array, derive a set of MatLab® commands that will discover the number of bits used to encode the aray.
A: Assuming the signal is sinusoidal and has an absolute average of 0
1) vxq=(xq*xq')./N; (N is the number of samples in xq)
2) int=max(xq) - min(xq);
3) q=round(log(int)/log(2))
3) Q: What formula would be used to describe the signal - to - distortion ratio if truncation were used, instead of rounding.
A: SDRT Z 3*(A/q)2
Conclusions
This lab has demonstrated the effect of voltage quantizing on a signal. It has illustrated two different methods of computing the signal - to distortion ratio. Both methods yield fairly accurate results (<10% error). It is interesting that the higher the number of bits used in quantization, the lower the error was in predicting the SDR. This gives a practical formula (S 1% for eight or more bits) for quantization. However, I believe that the ratio of deviations is a much more accurate formula, and actually yielded the correct results, as opposed to the formula. It appears that the value 6 needs to be greater for larger quantization interval, and less for smaller intervals.
Attachments
Original lab handout
Original lab data
Calculations
Octave log
GNU Octave, version 2.0.17 (i686-pc-linux-gnu).
Copyright (C) 1996, 1997, 1998, 1999, 2000, 2001, 2002 John W. Eaton.
This is free software with ABSOLUTELY NO WARRANTY.
For details, type `warranty'.
octave:1> n=0:511;
octave:2> t=n/512;
octave:3> x=1023*sin(2*pi*t);
octave:4> plot(t,x)
octave:5> xq=128*round(x./128);
octave:6> plot(t,x,t,xq)
octave:7> d=x-xq;
octave:8> plot(t,x,t,xq,t,d)
octave:9> vx=(x*x')./512
vx = 5.2326e+05
octave:10> vx=(x*x')./512;
octave:11> vd=(d*d')./511;
octave:12> vx=(x*x')./511;
octave:13> SDR=vx/vd
SDR = 415.96
octave:14> 1023/128
ans = 7.9922
octave:15> 2047/128
ans = 15.992
octave:16> 2048/(2^5);
octave:17> 2048/(2^5)
ans = 64
octave:18> xq5=64*round(x./64);
octave:19> d5=x-xq5;
octave:20> plot(t,x,t,xq5,t,d5)
octave:21> xd5=(d5*d5')./511;
octave:22> SDR5=vx/vd5
error: `vd5' undefined near line 22 column 9
error: evaluating expression near line 22, column 9
error: evaluating binary operator `/' near line 22, column 8
error: evaluating assignment expression near line 22, column 5
octave:22> vd5=(d5*d5')./511;
octave:23> SDR5=vx/vd5
SDR5 = 1622.1
octave:24> 2048/(2^6);
octave:25> 2048/(2^6)
ans = 32
octave:26>
octave:26> xq6=32*round(x./32);
octave:27> d6=x-xq6;
octave:28> plot(t,x,t,xq6,t,d6)
octave:29> vd5=(d5*d5')./511;
octave:30> vd6=(d6*d6')./511;
octave:31> SDR6=vx/vd6
SDR6 = 6418.7
octave:32> 2048/(2^7)
ans = 16
octave:33> xq7=16*round(x./16);
octave:34> d7=x-xq7;
octave:35> plot(t,x,t,xq7,t,d7)
octave:36> vd7=(d7*d7')./511;
octave:37> SDR=vx/vd7
SDR = 2.4974e+04
octave:38> 2048/(2^8)
ans = 8
octave:39> xq8=8*round(x./8);
octave:40> d8=x-xq8;
octave:41> plot(t,x,t,xq8,t,d8)
octave:42> vd8=(d8*d8')./511;
octave:43> SDR8=vx/vd8
SDR8 = 9.7060e+04
octave:44> plot(t,x,t,xq7,t,d7)
octave:45> vxq=(xq5*xq5')./511
vxq = 5.2749e+05
octave:46> log(xvq)/log(2)
error: `xvq' undefined near line 46 column 5
error: evaluating expression near line 46, column 5
error: evaluating argument list element number 1
error: evaluating index expression near line 46, column 1
error: evaluating binary operator `/' near line 46, column 9
error: evaluating assignment expression near line 46, column 9
octave:46> max(xq8)
ans = 1024
octave:47> min(xq8)
ans = -1024
octave:48> xvq/2048
error: `xvq' undefined near line 48 column 1
error: evaluating expression near line 48, column 1
error: evaluating binary operator `/' near line 48, column 4
error: evaluating assignment expression near line 48, column 4
octave:48> vxq/2048
ans = 257.57
octave:49> int=vxq/2048
int = 257.57
octave:50> q
error: `q' undefined near line 50 column 1
error: evaluating expression near line 50, column 1
octave:50> q=log(int)/log(2)
q = 8.0088
octave:51> round(q)
ans = 8
octave:52>